
Credit Double Threat on the Horizon
Recently, the WSJ reported on two positive credit trends in the US Economy. Individually, these trends are very positive for a growing economy, however, in combination, they could potentially be the foundation for another credit bubble way down the road.
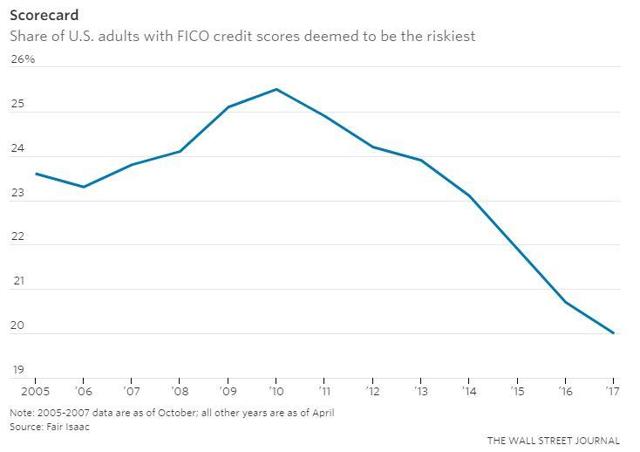
Credit scores for US consumers hit record levels last month with the average score nationwide at 700. That is a very positive statistic. Those consumers deemed the riskiest have dropped from nearly 26% of the nation in 2010 to 20% in 2017 according to credit scoring firm Fair Isaac. This group of higher credit risk Americans have gotten more credit worthy and are now just beginning to be able to get loans and credit cards previously unavailable to them. Moreover, many people who suffered foreclosures and bankruptcies will soon see those credit events “fall off” their credit reports. This will dramatically increase their capacity to borrow soon, the question is do they have the requisite capacity to pay what they borrow back? After repairing their balance sheets on paper, will they borrow again like they did before and perhaps get in trouble again? No one knows, but they will shortly have more options for sure.
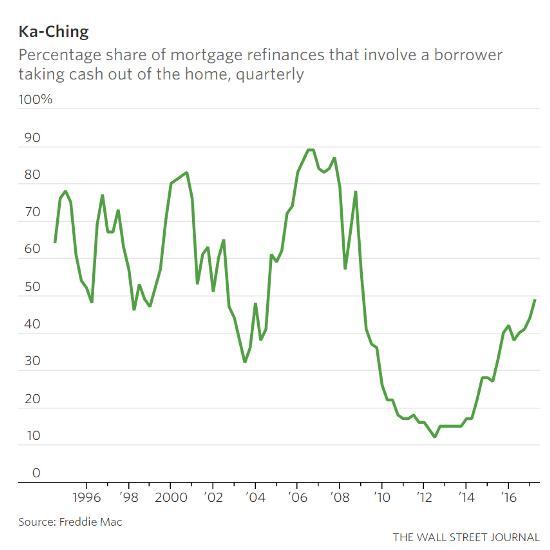
There is little doubt that more credit card and loan approvals will likely have a positive demand driven ripple effect on the economy. Since the economy began its prolonged recovery in 2010, housing prices are again near their peaks and in some areas, they have surpassed the levels we saw at their peaks in 2007. A flood of people who have been forced to rent due to their poor credit scores may re-enter the housing market further driving up prices of homes that they may not ultimately be able to afford. Combine that with the fact that according to the WSJ, nearly half of borrowers who refinanced their homes in the first quarter chose to cash out in exchange for equity built in their home. The Cash-out option when refinancing is what I call the second credit-threat. Refinance rates are currently at historic lows and the cash-out option is an easy way to borrow money cheaply.
This begs the question, what are they using that money for? With 2.65 Trillion dollars still sitting on the sidelines in money market funds, what on earth are people cashing out equity in their homes for? Is it to set up a rainy-day fund, pay off other debt or go on vacation? What exactly is it?
I see this double threat as a potential problem that could eventually build into a bubble again. While Freddie Mac is quick to point out that the amount of money Americans are taking out in cash is significantly less that what they were doing back in 2006, the amount is increasing as the graph above points out and if interest rates remain at historic lows, I see a trend building here. If you combine this trend with many new potential homebuyers of the riskiest ilk starting to home shop again, we could potentially see another bubble that no one wants to burst.
Disclosures: This post is solely for informational purposes. Past performance is no guarantee of future returns. Investing involves risk and possible loss of principal capital. No advice may be rendered by RHS Financial, LLC unless a client service agreement is in place. Please contact us at your earliest convenience with any questions regarding the content of this post. For actual results that are compared to an index, all material facts relevant to the comparison are disclosed herein and reflect the deduction of advisory fees, brokerage and other commissions and any other expenses paid by RHS Financial, LLC’s clients. An index is a hypothetical portfolio of securities representing a particular market or a segment of it used as indicator of the change in the securities market. Indexes are unmanaged, do not incur fees and expenses and cannot be invested in directly.
2024 Disclosures
RHS Financial is an SEC registered Investment Advisory Firm and distributes this presentation for informational purposes only. This presentation ( hitherto referred to as the presentation throughout this disclosure), blog post, infographic, slide deck or whatever form of informational modality the reader wishes to describe this as is provided for informational purposes only and should not be construed as investment advice in any way.
We believe the information, including that obtained from outside sources, to be correct, but we cannot and do not guarantee its accuracy in any way. RHS Financial uses information from outside sources to develop graphs, charts, infographics, etc. to enhance this presentation and while we believe the information from these outside sources, to be correct, we cannot and do not guarantee its accuracy in any way,
Any opinions or forecasts contained herein reflect the subjective judgments and assumptions of the authors who may be employees of but do not necessarily reflect the views of RHS Financial as a company. There can be no guarantee that developments will play out as forecasted. The information in this presentation is subject to change at any time without notice. This presentation contains “forward-looking statements" concerning activities, events or developments that RHS Financial expects or believes may occur in the future. These statements reflect assumptions and analyses made by RHS’s analysts and advisors based on their experience and perception of historical trends, current conditions, expected future developments, and other factors they believe are relevant. Because these forward-looking statements may be subject to risks and uncertainties beyond RHS Financials’ control, they are no guarantees of any future performance. Actual results or developments may differ materially, and readers are cautioned not to place undue reliance on the forward-looking statements. In a nutshell; these are our best guesses and please don’t assume they are fact.
Mentions of specific securities, investment products, investment indices, companies or industries should not be considered a recommendation or solicitation. Data and analysis does not represent the actual or expected future performance of any investment or investment product Index information is used to illustrate general asset class exposure, and not intended to represent performance of any investment product or strategy.
This post may contain references to third party copyrights, indexes, and trademarks, each of which is the property of its respective owner. Such owner is not affiliated with RHS Financial and does not sponsor, endorse or participate in the provision of any RHS’ services, or other financial products. Index information contained herein is derived from third parties and is proffered to you unaltered as we derived it from the third party.
RHS Financial, LLC is a Registered Investment Adviser. Advisory services are only offered to clients or prospective clients where RHS Financial, LLC and its representatives are properly licensed or exempt from licensure. This presentation is solely for informational purposes. Past performance is no guarantee of future returns. Investing involves risk and possible loss of principal capital. No advice may be rendered by RHS Financial, LLC unless a client service agreement is in place.
If the client is deemed suitable and agrees, RHS may employ leveraged strategies for these clients. Leverage attained through margin on a client’s account can add additional risk. While RHS tends to seek to improve return with theses strategies by applying leverage to less risky indexes, there is no guarantee that that RHS will lower risk or improve returns.
RHS Financial. 4171 24th St. Suite 101 San Francisco, CA 94114