
Quantquake: 2020 and the Revenge Against the Nerds
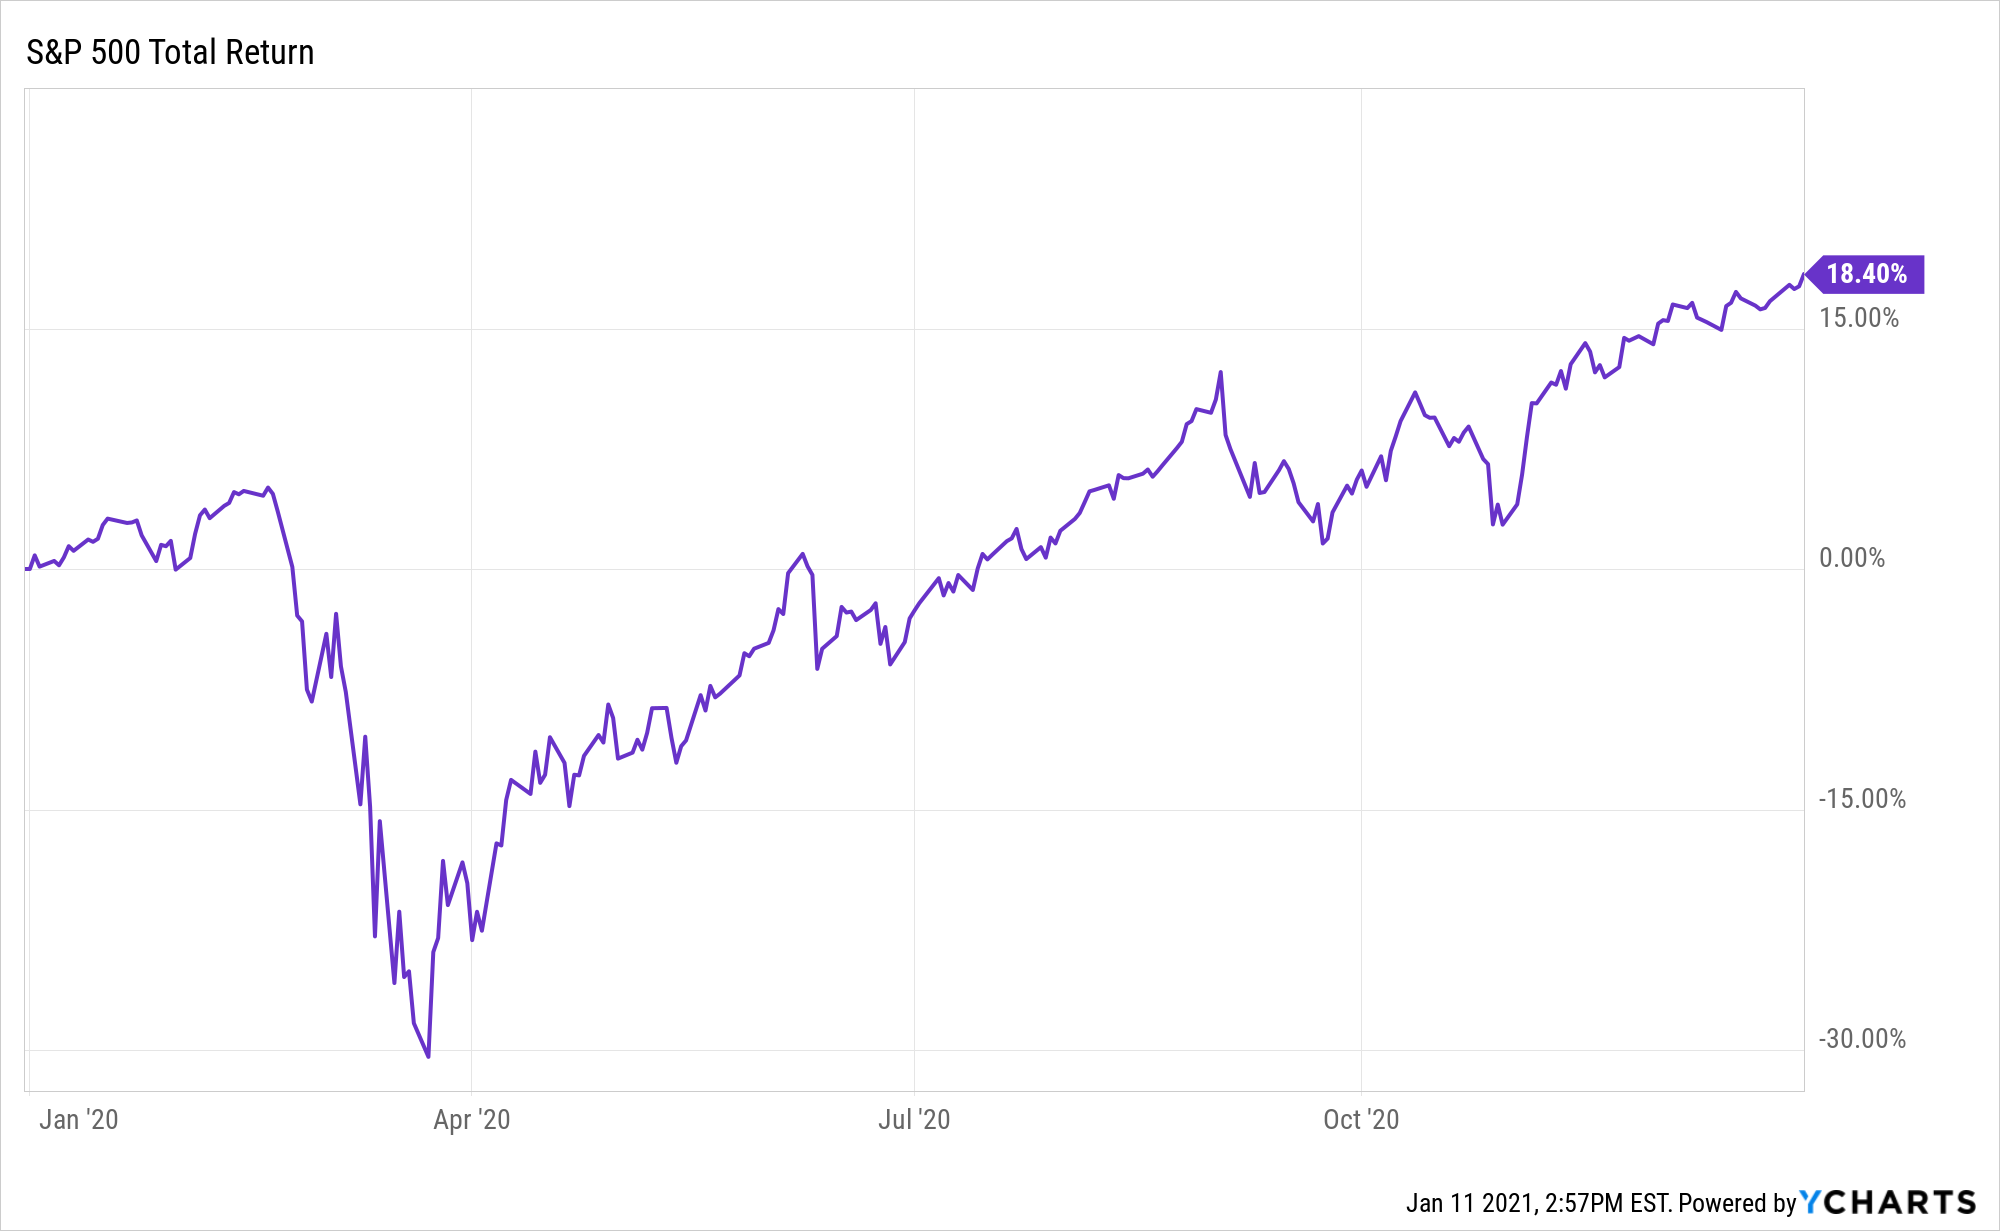
2020, the most fascinating and boring year of my life, is over, and despite one of the most violent market crashes in history and the sharpest recession of all time, US equity investors clocked in another good year on the calendar. The S&P 500 index finished the year up 18.4%; this despite being down by as much as 30% in March, making 2020 one of the wildest swinging markets in history.
But if you didn’t earn double digit returns last year you were in good company. The bull market was extremely concentrated in a narrow subset of stocks and most others floundered over the year. By my count, of the top 5,000 stocks trading on US exchanges (this includes over a thousand foreign stocks with US listings), only a little over half finished 2020 in positive territory and the median return was only 4.3%. If you didn’t have the good fortune to buy the few winners you were left behind, as happened with some of the industry’s best. Many of the world’s largest and previously most successful hedge funds and institutional money managers had a terrible 2020, including the top two: Ray Dalio’s Bridgewater Associates and Jim Simon’s Renaissance Technologies, each famous for their billionaire visionary founders, uniquely secretive/creepy company culture, and astounding market-beating performance over decades, each suffered negative double-digit returns in their main funds in 2020. Similarly, some of the industry’s most highly regarded names such as AQR, Two Sigma, and Dimensional Fund Advisors all suffered massive investor redemptions in the face of substantial underperformance in 2020.
All these fund managers pursue a variety of different strategies in a variety of different markets, but they all have one thing in common: they’re quants. They take a data-driven approach to investing, using mathematical models based typically on decades of market returns to execute their strategy, often employing teams of Ph.D mathematicians, computer scientists, and economists to crunch the numbers. They generally pay little attention to the “human interest” elements of investing like the executive bio or squishy concepts like “product market fit” or five year strategic plans. There are a lot of different ways to be a quant, but if you are one, or invested with one in 2020, you probably had a bad year. 2020 was the year of the swashbuckling stock-picker. As Bloomberg declared in a year-end article, Human-Run Hedge Funds Trounce Quants in Covid Year. 2020 was the revenge against the nerds.
So what happened? Leo Tolstoy famously wrote, “All happy families are alike; each unhappy family is unhappy in its own way.” So it was with investing in 2020, there were many different investing strategies that went unhappily in 2020, and all the strategies that went happily looked pretty much the same. Let’s look at the unhappy families first and then return to the one thing that went well in 2020.
Diversification
2020 saw a repeat of something we’ve witnessed a few times in the last decade, not only did US stocks have an especially good year, they did substantially better than pretty much every other market. Investors who diversified across multiple asset classes, therefore, had much weaker returns.

Just about the only major asset that beat the S&P 500 last year was gold. The shiny metal held its weight during the crisis in March and powered through the rest of the year. Emerging market stocks also put in a solid year, virtually tied with the US market, despite suffering an even harder crash in March. Most other major assets, however, had much more modest returns, including the stock markets of most other rich, industrialized nations. Investors diversified across these major markets still likely had reasonably positive returns, but were a far cry from the meteoric rise of the S&P 500.
Of course, how investors allocated both across and within these asset classes was of tantamount importance to their outcomes in 2020, and generally these outcomes frustrated quants at every turn. Whether picking stocks within a market or allocating across asset classes, quants often rely on measures of valuation, volatility, or momentum to guide their process, based on the historical success of these metrics in predicting returns, and in nearly every case following the numbers led investors astray in 2020, starting with perhaps the most time-tested of financial strategies, value investing.
Value and Fundamentals
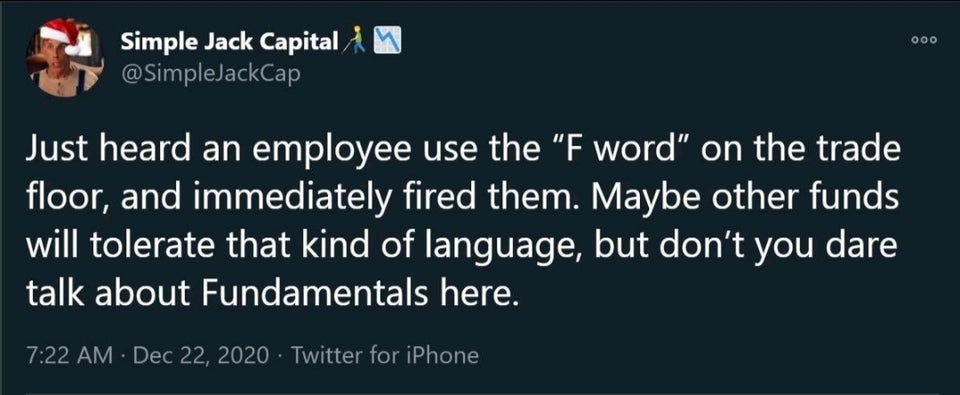
For investors like yours truly who believe markets ultimately have to have some relation to reality, the following joke tweet from December is a little too on the nose.
Value investors ask the same seemingly reasonable question of investments we all ask when we’re considering buying a good or service: is the price I have to pay a good deal compared to the quality I’m getting? In practice this generally means value investors seek to buy assets whose prices are low relative to their cashflows or other economic fundamentals. Value investing has an intellectual pedigree going back to at least the 1920s with the classic writings of Graham and Dodd and is perhaps most famous for their most successful student, Warren Buffett (who also didn’t do so well last year). Value investing has been out of favor for several years now, especially in the US market, something I documented extensively in my two part series last year on market valuations.
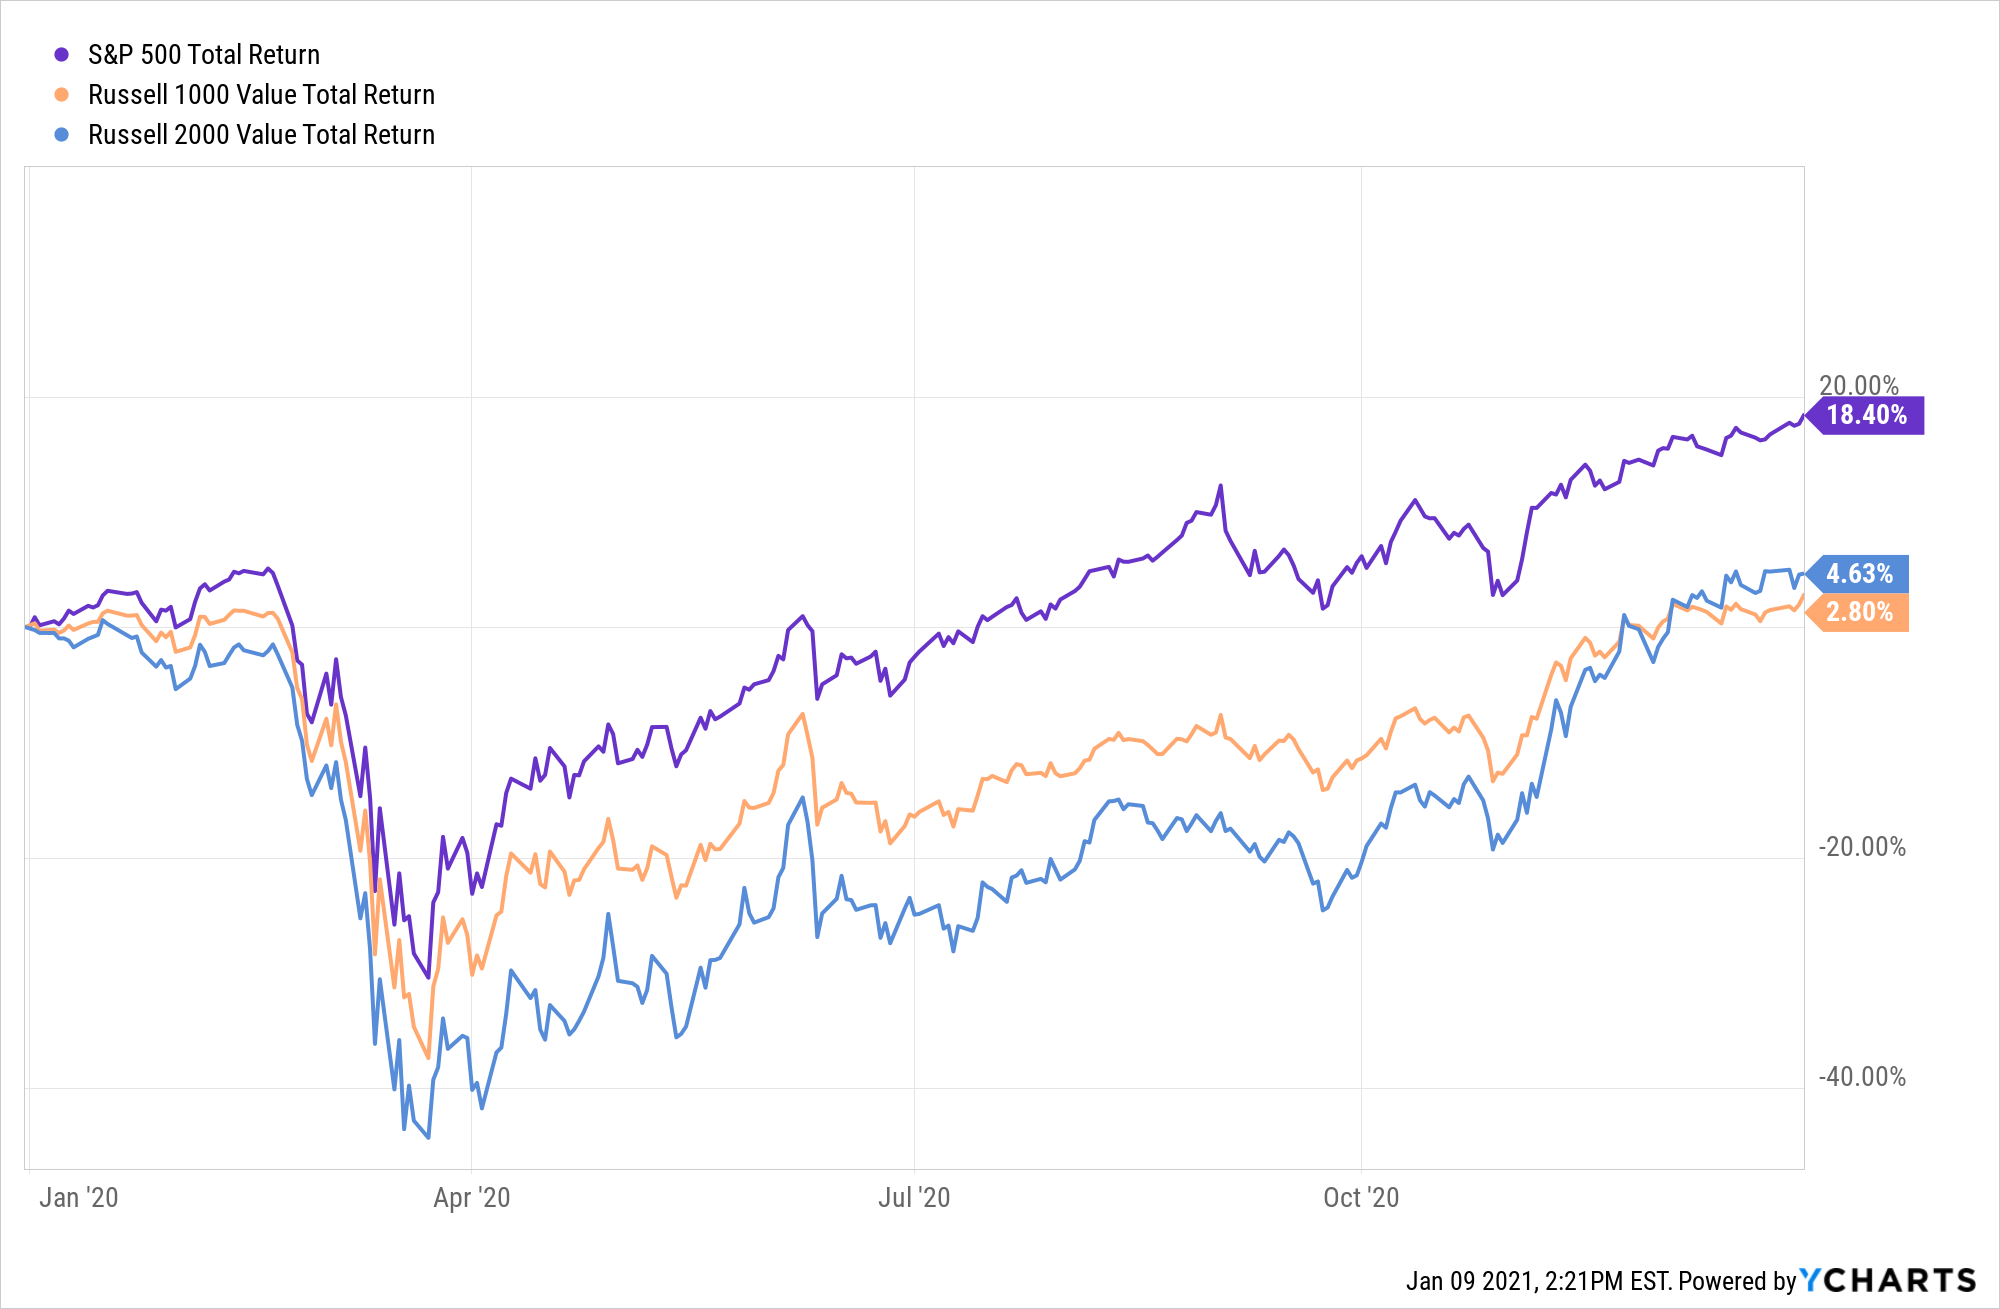
Last year was a miserable one for value investors. Within the US market, value stocks lagged the market in the first couple months, fell further during the crash, and recovered slower than the rest of the market. Though they rallied harder in the last two months of the year, value stock both large and small finished the year finished the year just barely above zero, as judged by the commonly followed Russell 1000 Value (large stocks) and Russell 2000 Value (small stocks) indexes.
Applying the value effect around the world gave even worse results. Choosing between stock markets, the US started the year the most expensive market in the world, and those in Europe were among the cheapest. But as we saw, the US market became more expensive still, and European stock investors barely ended the year in positive territory. Value stocks within foreign markets similarly failed to keep up with their broader market aggregates. One index of value stocks around the world, the MSCI ACWI Value Index, finished the year up a mere 0.42%. Taking an even more expansive view of valuation and applying it across global assets, buying those stocks, bonds, commodities, and currencies measured as cheap and selling those measured as expensive would have lost you about 12% in 2020 (through November) according to AQR’s methodology.
Skeptics of value investing often point out that value stocks are usually cheap for a reason: they’re junk. Indeed, if you simply sort the market based on a simple valuation metric like price to book ratio you’ll often find that the most undervalued stocks are in declining industries, have weak balance sheets and margins, and are projected to lose market share. Value investors often try to avoid “value traps” like this by augmenting their value factors with metrics to score some measure of “quality”, looking at profitability measures like return on equity, for example. Adding such quality filters would have only made things worse in 2020. Among the cheapest stocks in the market, the most profitable among them did the worst last year.
Professor Ken French keeps an invaluable online database to quants that records the track records to different portfolios of stocks sorted on a variety of metrics. Looking at a double-sorted portfolio of the stocks that are in the lowest quintile of valuation and the highest quintile of profitability, here’s how such a portfolio did last year (through November) compared to the S&P 500.
 The most profitable, cheapest stocks in the US lost more than half of their value in the crash last year, before recovering to end up down “only” about 20% last year, a staggering 33.8% behind the S&P 500.
Take a moment to consider how counterintuitive this ought to seem. I think most people, even without much financial savvy, would consider the strategy of “buy highly profitable companies at attractive valuations” to seem like a fairly reasonable one, the sort of things that might actually deliver superior results over the long run, and indeed if we look at the long run data it has, as we’ll see further down the page. You might even suspect that such a prudent strategy might shine especially during a period of great economic tumult and uncertainty, and indeed it often has historically. But that is absolutely not what happened during the chaos of 2020. And that wasn’t the only curveball 2020 threw quants either.
Low Volatility/Risk Parity
After value, low volatility strategies are some of the most commonly used quant approaches of the last decade. Research going back to the 70s shows that those stocks whose prices are relatively more stable tend to roughly keep up with the rest of the market or nearly so when times are good, but lose far less value during panics and bear markets. Thus, over the long run they’ve done about as good or better as the rest of the market with a lot less risk. That is… decidedly not what happened last year. Within the US market, two of the most popular quant funds of recent years have been the iShares US Minimum Volatility ETF and the Invesco S&P 500 Low Volatility ETF, two ETFs that use a quantitative approach to pick the least volatile stocks within the US market. With tens of billions of dollars between them, here’s how these two flavors of low volatility stock investing did last year.
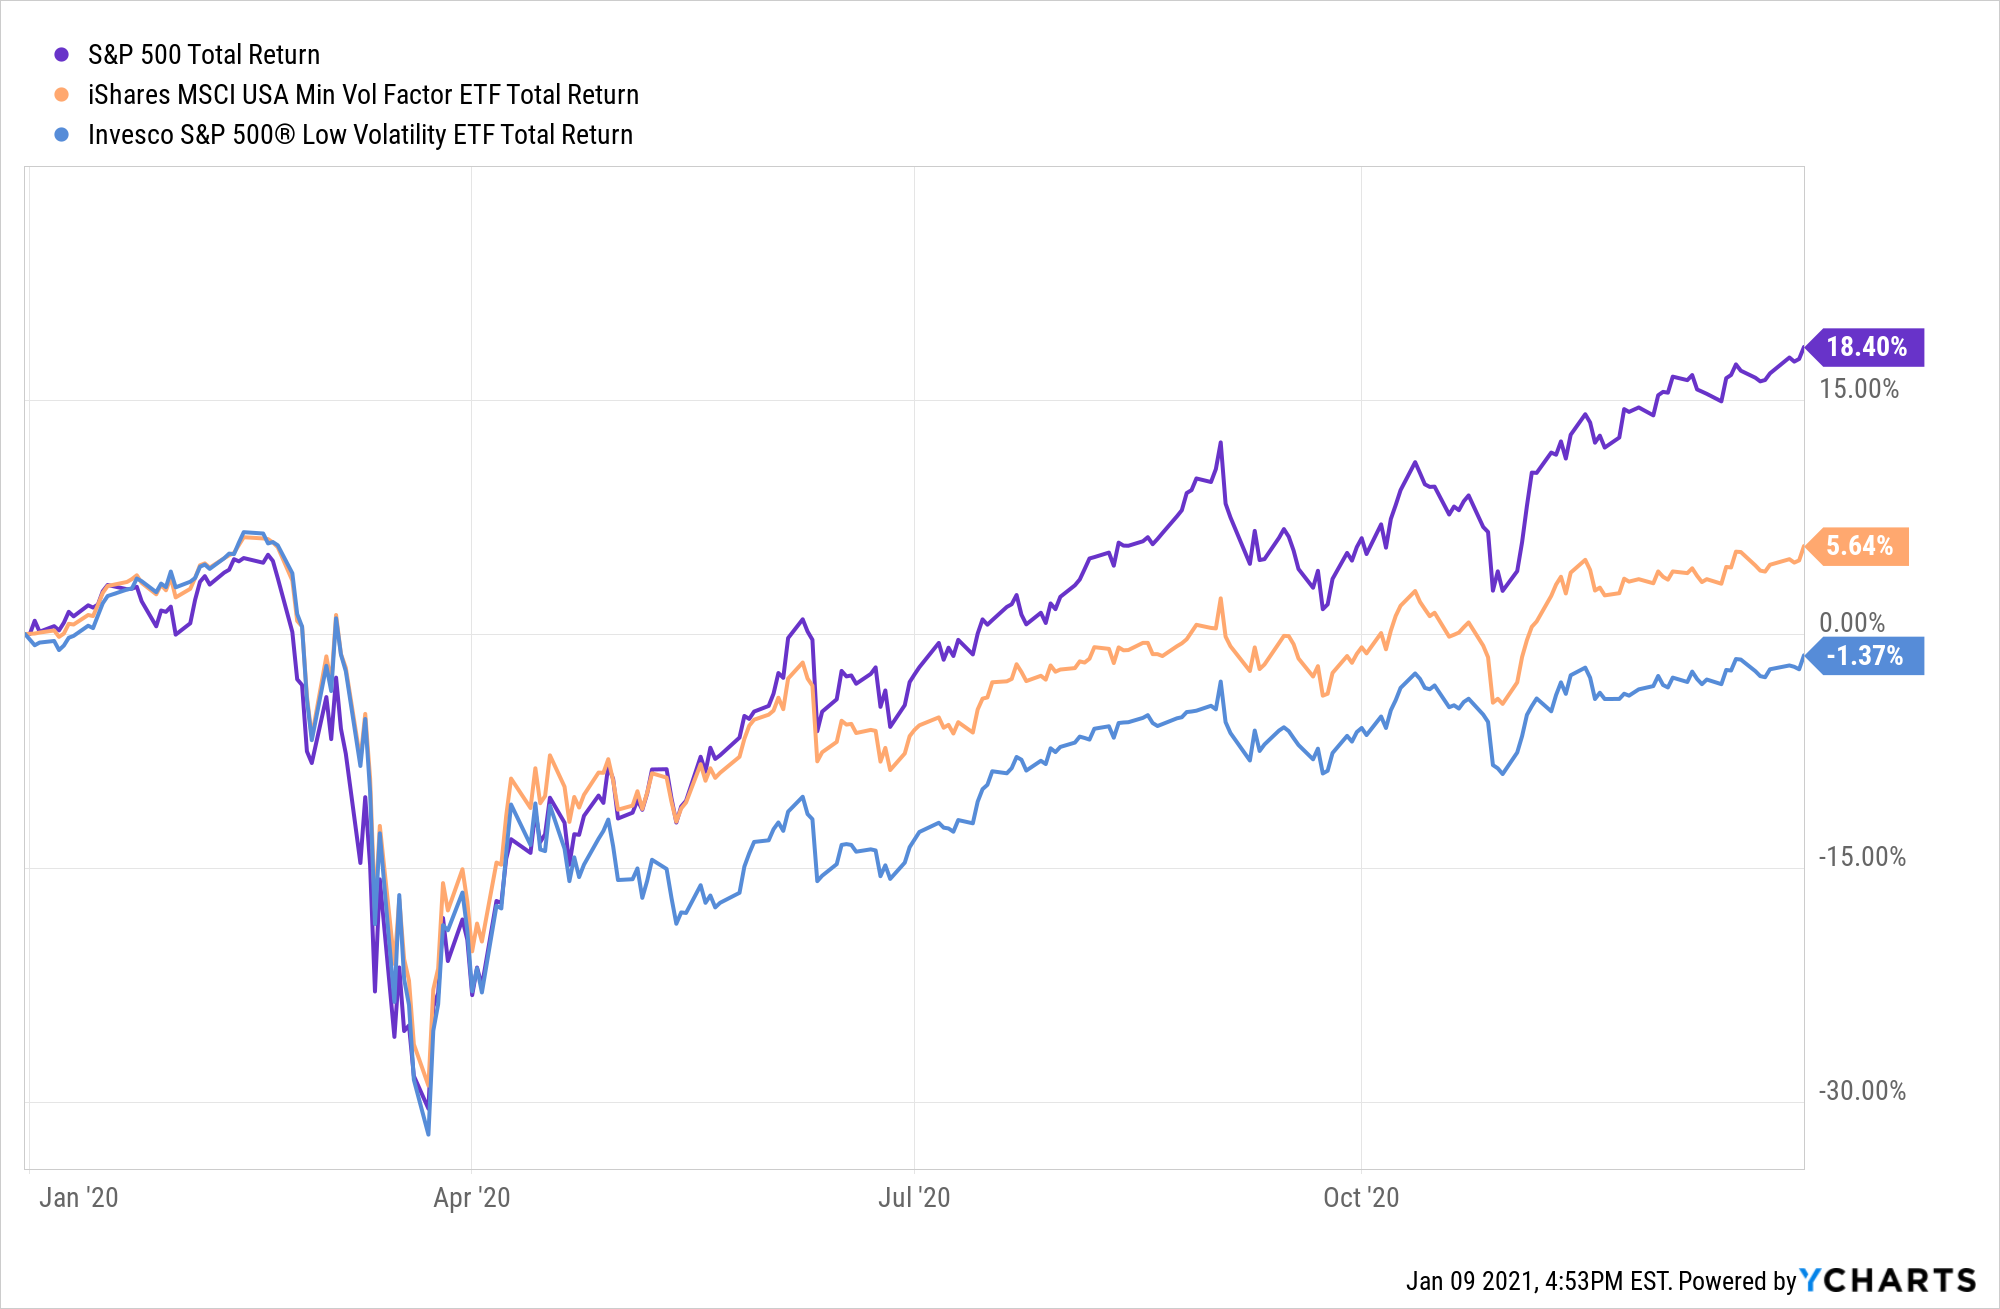
Yikes. Low volatility investing in the US was just about as bad as value investing was, despite being a completely different conceptual approach and not being very much correlated with each other. Though they have tended to lose less in previous bear markets, low volatility stocks lost just as much as the rest of the market during the COVID crash, but experienced a much more muted recovery. They were only low volatility when you didn’t want them to be! Results in foreign stock markets were similar, if not quite so extreme. Depending on what methodology you used, low volatility stocks in international developed and emerging markets underperformed their broad market counterparts by several percentage points in 2020.
A cousin of low volatility investing is Risk Parity, which is usually applied to entire markets for use as an asset allocation technique. Risk Parity strategies invest in asset classes weighting them inversely proportional to their volatility (or other measures of risk such as beta). This means less risky asset classes like bonds tend to get higher weights than stocks, and the relative weights adapt dynamically to changing volatility dynamics in the market. Because a typical risk parity portfolio is fairly conservatively allocated, leverage is then usually applied to it in order to achieve a certain target level of risk.
I’ve written before on this blog about how Risk Parity and related approaches to investing have historically delivered very desirable results, potentially beating a stocks-only allocation with lower risk and less-protracted bear markets. Unfortunately, as with low-risk investing in equities, 2020 turned this experience on its head. The largest risk parity fund available to individual investors is the one managed by the popular robo-advisor Wealthfront (arguably a quant for smaller investors). Their flagship fund finished the year down over 6%.
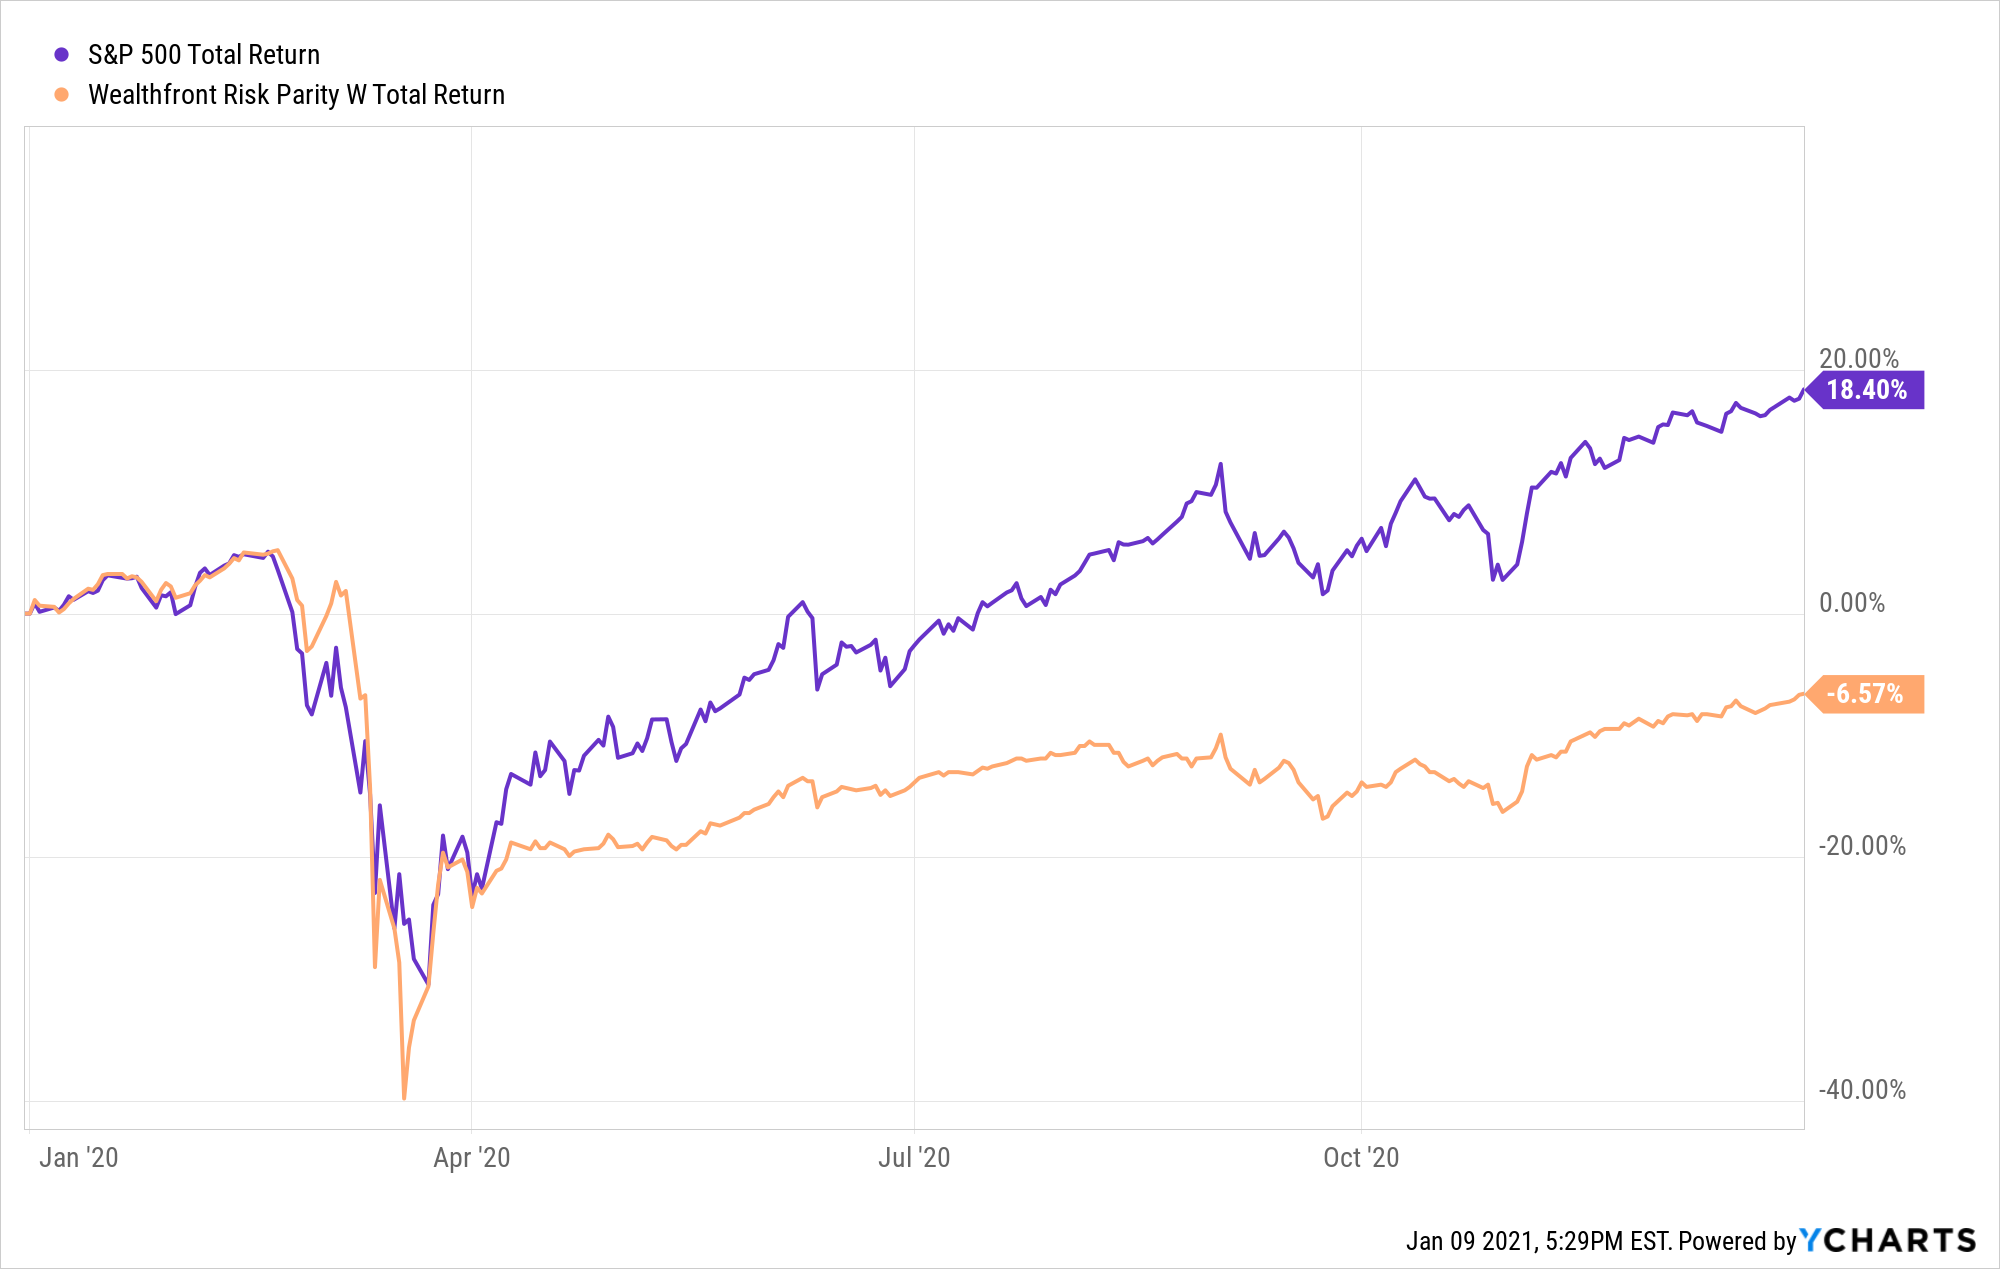
This appears to a bit worse than usual, but pretty much all risk parity or related strategies suffered the same setback that plagued low volatility investing in equities: due to the extreme and sudden nature of the crash in March and the fact that it subsided almost as quickly, risk parity strategies couldn’t adapt quickly enough to protect on the downside, and reduced risk exposure just as the market was rebounding.
Momentum/Trend Following
One quant strategy that’s all about adapting quickly is momentum investing, which refers simply to the strategy of buying those assets that have been outperforming recently (usually defined as the last 3-12 months) and selling those that have been underperforming. While traditional, fundamentals-oriented investors tend to look askance at momentum approaches (value investors say “buy low, sell high”, momentum investors say “buy high, sell higher”), the empirical data in support of it is vast. The momentum effect has been observed in virtually every market we have data on, sometimes going back centuries. Behavioral finance literature also provides theoretical support for the momentum effect based on observations of investor overconfidence and overreaction.
Anyway, momentum investing in the stock market was one of the only bright spots for quants in 2020. Whether applied just within the US market or around the world, momentum stocks outperformed the S&P 500 by 10% or more last year, as measured by MSCI’s momentum indexes.
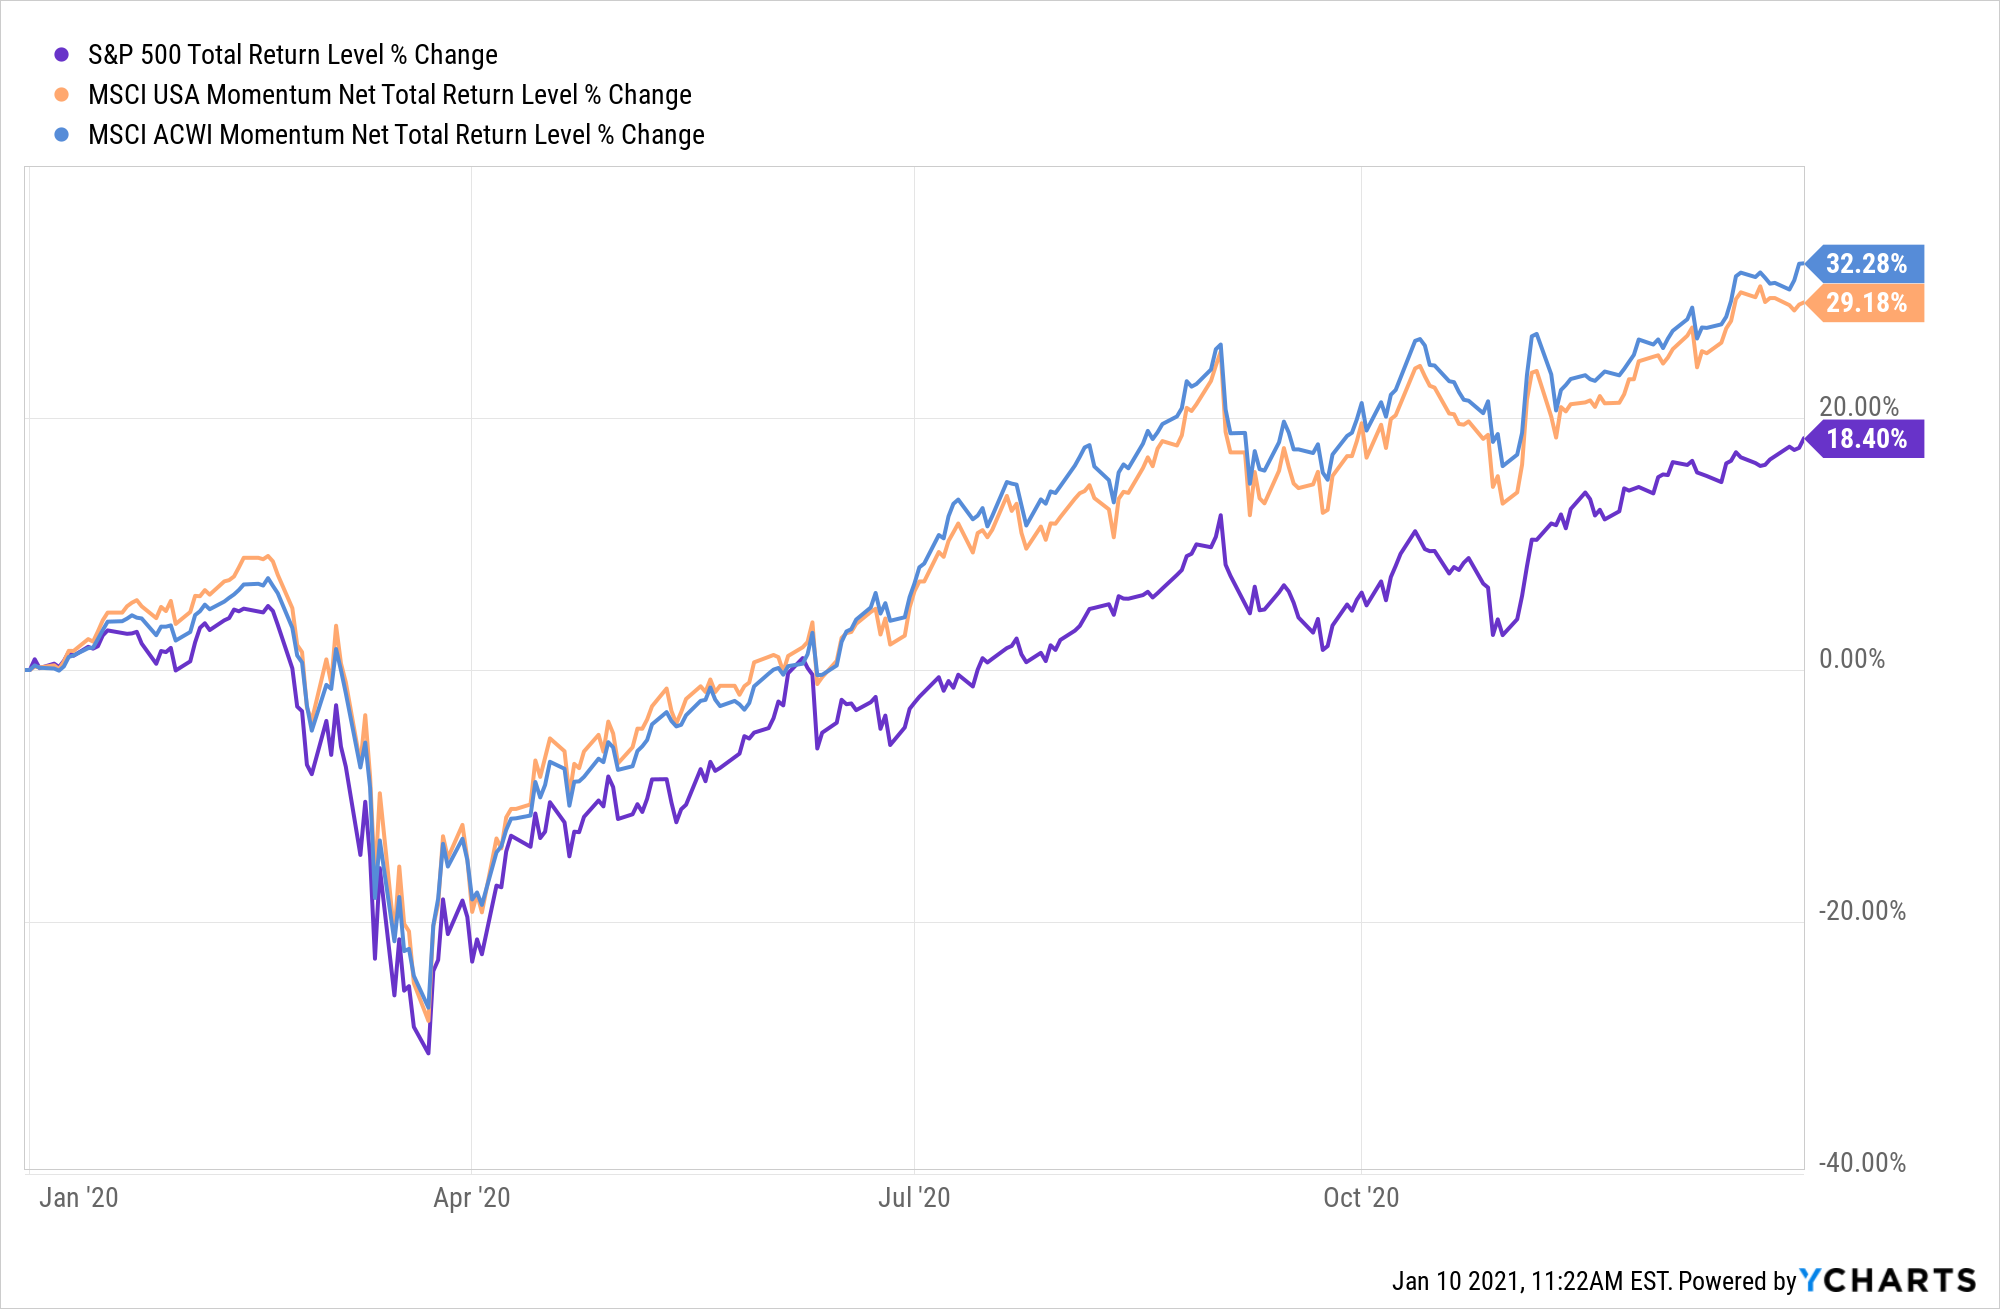
Momentum strategies were piled into high-flying tech stocks at the start of the year, which went on suffer less during the crash and recover much more rapidly throughout the rest of the year. But while momentum was a boost for many quant investors, it generally wasn’t great enough to overcome the tremendous drag from value, quality, and low volatility strategies if one was pursuing all of the above in tandem. Furthermore, in an unusual turn of events, while momentum applied to stocks was a great success last year, momentum applied to asset classes went nowhere.
When applied to asset classes, momentum strategies are usually referred to as “trend following” and are often implemented by going both long and short different assets using derivatives like futures, such “managed futures” funds are among the most commonly used hedge fund strategies and have historically delivered stock-market-like returns with little to no correlation to stock or other major asset classes. S&P maintains their own index of what a typical trend following strategy might look like, here’s how it did last year.
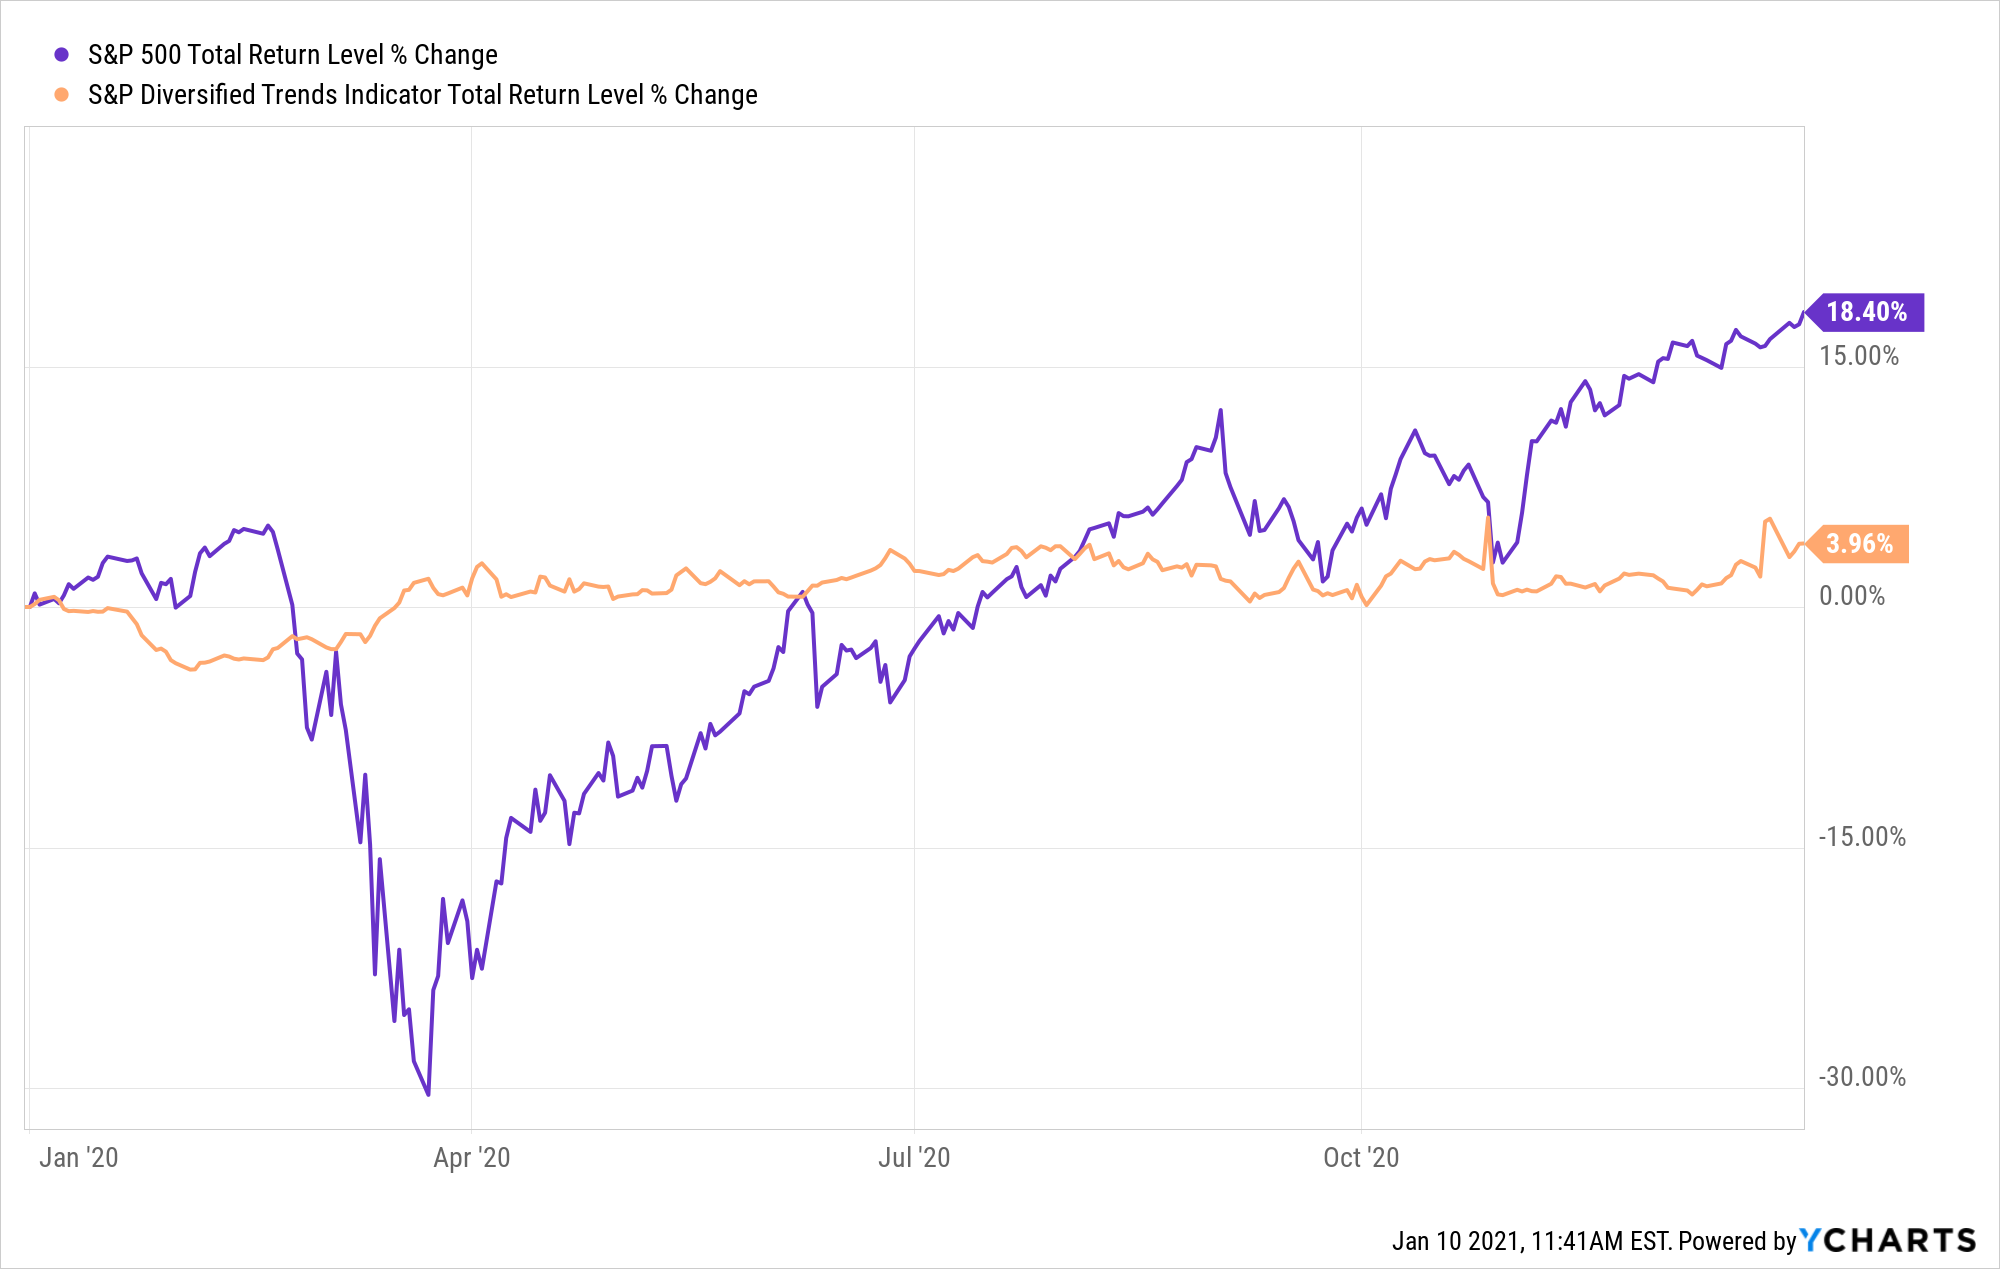
Trend following strategies generally got out of stocks and into bonds going into March, and so did a great job protecting against the turmoil of that month, but they never managed to capitalize on the upside. Trend followers generally didn’t get back into stocks until July or August, and then were wipsawed back and forth by gyrations in commodity, currency, and fixed income markets.
What Worked: Believing the Hype
These strategies are of course not the only ones that quants employ; entire books can and have been written about all the ways quantitative managers have been able to successfully add value in the markets. Looking at index measures of other commonly used quant strategies the same pattern emerges. A few like event-driven arbitrage did quite well last year, but many more like options writing strategies, relative value, currency carry, and merger arbitrage had low single digit or even negative returns for the year. Not surprisingly, Credit Suisse’s measure of aggregate hedge fund performance has the entire industry up only 2.49% for 2020 (through November).
To overgeneralize a bit, I might bucket all these different approaches into two main camps. The first are strategies that are about supplying liquidity to and establishing the fair value of securities within the market. The second are strategies meant to “ride the tiger”, to follow the herd wherever they lead, be they attached to reality or not. 2020 was all about the latter; in a year with such awful fundamentals the thing that really worked was lofty aspirations of transformational technological change.
I pointed out above how lopsided last year’s market was, with nearly half of all stocks losing money despite strong returns for the market overall. Good returns were concentrated into a relatively narrow subset of stocks, and these winners tended to have a lot in common. They were very expensively valued, weakly or unprofitable, highly volatile stocks, mostly in industries associated with rapid technological change. Hype stocks, if you will.
Now, if I told you in the abstract that I have a great investment idea for you, I want you to buy this stock that is trading at an insanely highly valuation so everything has to go right for it to pay off, but fundamentally the company is losing money and in a weak financial position, and the stock is extremely volatile so there’s a much heightened chance of total loss, you might look at me like I’m crazy. Why take a gamble on what seems like such an unlikely bet? Well, often such stocks are in such a state because they have great story. They are scrappy upstarts that are trying to change the world and wrest market share from the powers that be. They haven’t proven themselves yet but once they do the world will be their oyster.
If we roll back the clock one year and look at which stocks scored the highest in terms of valuation, volatility, and lack of fundamental financial performance a familiar list of names comes up. Just about at the top of the list was the true champion of last year’s market: Tesla, followed closely by names like Netflix, Pelaton, Beyond Meat, Pinterest, Square, and everybody’s favorite new communications platform that they can’t stand anymore: Zoom.* All of these companies beat the market many-fold last year and of course are now even more extremely valued. (An amusing irony of all this is that so many of last year’s most successful companies are in the business of algorithms, whereas algorithmic investors often avoided them and were left behind. Last year was good for tech nerds but bad for finance nerds.)
I’m cherry-picking a little bit here of course, but let’s look at what would have happened if you just did the opposite of the “low valuation, high profitability” strategy shown above and picked a portfolio of stocks with the highest quintile of valuation and lowest quintile of profitability and held that for 2020. Again using Ken French’s data through November:
 The speculative “hype stock” portfolio was up 71.7% through November of last year and beat the “prudent” portfolio by an astounding 91.5%. Adding a screen for higher volatility probably would have improved speculative picks even more. French’s data also shows that the most volatile quintile of stocks earned a 34.4% return over the same period, besting the S&P 500 by about 20%. Numbers like these tend to make believers out of skeptics, especially when they are the culmination of a several year process witnessing the same pattern. In my last posts I argued that valuations have been diverging from fundamentals since about 2014. Let’s see how these opposing portfolios have done since then:
 Wow, hype stocks have been beating quality value stocks for seven years running. Granted, adding a low profitability filter to a high valuation portfolio really only added value in 2020. You would have been better off overall if you’d bought a broader portfolio of just high-priced stocks. Highly profitable value stocks, however, have been underwater for a miserable seven years, even at a time when the market has been up a great deal.
To most investors, seven years seems like a long time, long enough to look at a graph like this and conclude confidently which is the better strategy. Maybe these traditional financial methods about valuations and cashflows are just outdated in today’s rapidly changing technological landscape? Sure, a lot of these tech stocks seem pretty expensive, but there’s nothing that says they can’t become even more expensive still, right? I explained last time why logically this is actually impossible. Prices cannot deviate from fundamentals forever because eventually there literally isn’t enough money in the world for valuations to rise further. But things can deviate for quite a while before we reach such an extreme, which is why most quants willing to stick to their guns would conclude that no, seven years actually isn’t a very long time over which to evaluate an investment strategy. Certainly the broad stock market itself has suffered through seven year drawdown many times throughout history and always come back, so there’s every reason to suspect most quant strategies would as well. So let’s zoom out further. French’s data goes back to 1963, here’s what it’s like since then.
 Over this ~57 year period, this simple quality value strategy has outperformed the S&P 500 by about 3% per year, generating more than 5x the compounded wealth over that time frame. The hype stock portfolio, however, returned only 3.1% annualized, and amazingly, all of that has come since about 2012! For the 50 year period from 1963 to 2012 the strategy of buying the highest-flying speculative stocks made absolutely no money whatsoever! Independent research has confirmed similar findings in other markets and going back even longer time frames.
We can see there are a couple other periods in history when hype stocks outperformed for a while before giving up their gains: the late 1990s and the late 1960s. What do these two periods have in common with today? The 90s, as we know, was the dot-com bubble. The late 60s was the today-lesser-known Nifty Fifty period, a mini tech bubble in its own right (The joke is every startup in the 90s started with “e-“, every startup in the 60s ended with “-tronics”). Like today, each of these periods was marked by a widespread belief that the companies of yore were falling into obsolescence and technological disruption meant the traditional notions about financial valuation had to be discarded.
Sure, you can argue that the recent tech bull market has lasted longer than previous ones, or point to any of a number of plausible-sounding reasons for why today things are totally different than in the past and things will never be the same. Part of the problem with what I’ve laid out above is that it’s all couched in the language of quant-speak, which many people are not fluent in. Nobody buys “highly volatile, unprofitable and overvalued” stocks of course, they buy “exciting growth opportunities.” Nobody chooses to follow an investment strategy that hasn’t worked for 57 years besides the last few, they invest in what are going to be the winning industries and technologies of the future, and that has nothing to do with whatever foolish decisions people may have made back in the 90s or whenever.
The difference between the quant view of the world and the alternative is I think not so much the use of numbers, per se, but the use of what the psychologist Daniel Kahneman called the “inside view” or the “outside view.” From his 1993 paper on the topic, “an inside view forecast is generated by focusing on the case at hand, by considering the plan and the obstacles to its completion, by constructing scenarios of future progress, and by extrapolating current trends. The outside view… essentially ignores the details of the case at hand, and involves no attempt at detailed forecasting of the future history of the project. Instead, it focuses on the statistics of a class of cases chosen to be similar in relevant respects to the present one.” We naturally tend to take an inside view of our own minds. We tend to view our personality, tastes, and beliefs as the result of a unique personal history and inner reflection. We tend to recoil at the notion that we can be mostly described by an outside view that we belong to a set of demographic characteristics like age, race, sex, location, and income and our behavior is largely predictable based on these, yet marketing experts have no problem relying on these factors when they’re trying to sell us stuff.
Similarly, the natural inclination of most investors is to look at a stock and ask inside view questions like “what challenges does this company face and how might it overcome them?” or at a broader level try to predict where the overall market is going by asking something like “will the Fed’s new approach to monetary policy boost asset prices or just lead to more inflation?” The quant view of the world is that questions like these are mostly either un-answerable or unimportant; there’s nothing new under the sun and everything that’s happened is like something else that’s happened before, which means we can collect data on it and rely on statistics instead of stories. Will Tesla become the dominant auto manufacturer in the world and end up supplying a large fraction of utility-scale battery electricity like the bulls say? I have no idea. But I do know what Tesla’s price to earnings ratio is, its return on equity, its price volatility, etc. And I can compare these metrics to other stocks and see how stocks with similar characteristics have done over time.
Such a measured, dispassionate view is the core of the quant approach to investing, and we know from our data that periodically there are years like 2020 where seemingly nothing works except for all of the bad ideas. We also see in the data that eventually such periods pass and eventually numeracy triumphs over hype. 2020 was a weird year, the weirdest ever for many of us. But just a passing knowledge of history teaches us that actually it wasn’t that weird. Humanity has lived through plagues before, not to mention wars, revolutions, famines, droughts, financial bubbles and panics, technological disruptions, and cultural transitions before, and it will continue to do so. For quants it’s all just more data to use in building scientific strategies that should win in the long run.
*Note, this article mentions numerous individual securities: this is not a solicitation or recommendation to purchase or short sell any of the securities mentioned in this post.
2024 Disclosures
RHS Financial is an SEC registered Investment Advisory Firm and distributes this presentation for informational purposes only. This presentation ( hitherto referred to as the presentation throughout this disclosure), blog post, infographic, slide deck or whatever form of informational modality the reader wishes to describe this as is provided for informational purposes only and should not be construed as investment advice in any way.
We believe the information, including that obtained from outside sources, to be correct, but we cannot and do not guarantee its accuracy in any way. RHS Financial uses information from outside sources to develop graphs, charts, infographics, etc. to enhance this presentation and while we believe the information from these outside sources, to be correct, we cannot and do not guarantee its accuracy in any way,
Any opinions or forecasts contained herein reflect the subjective judgments and assumptions of the authors who may be employees of but do not necessarily reflect the views of RHS Financial as a company. There can be no guarantee that developments will play out as forecasted. The information in this presentation is subject to change at any time without notice. This presentation contains “forward-looking statements" concerning activities, events or developments that RHS Financial expects or believes may occur in the future. These statements reflect assumptions and analyses made by RHS’s analysts and advisors based on their experience and perception of historical trends, current conditions, expected future developments, and other factors they believe are relevant. Because these forward-looking statements may be subject to risks and uncertainties beyond RHS Financials’ control, they are no guarantees of any future performance. Actual results or developments may differ materially, and readers are cautioned not to place undue reliance on the forward-looking statements. In a nutshell; these are our best guesses and please don’t assume they are fact.
Mentions of specific securities, investment products, investment indices, companies or industries should not be considered a recommendation or solicitation. Data and analysis does not represent the actual or expected future performance of any investment or investment product Index information is used to illustrate general asset class exposure, and not intended to represent performance of any investment product or strategy.
This post may contain references to third party copyrights, indexes, and trademarks, each of which is the property of its respective owner. Such owner is not affiliated with RHS Financial and does not sponsor, endorse or participate in the provision of any RHS’ services, or other financial products. Index information contained herein is derived from third parties and is proffered to you unaltered as we derived it from the third party.
RHS Financial, LLC is a Registered Investment Adviser. Advisory services are only offered to clients or prospective clients where RHS Financial, LLC and its representatives are properly licensed or exempt from licensure. This presentation is solely for informational purposes. Past performance is no guarantee of future returns. Investing involves risk and possible loss of principal capital. No advice may be rendered by RHS Financial, LLC unless a client service agreement is in place.
If the client is deemed suitable and agrees, RHS may employ leveraged strategies for these clients. Leverage attained through margin on a client’s account can add additional risk. While RHS tends to seek to improve return with theses strategies by applying leverage to less risky indexes, there is no guarantee that that RHS will lower risk or improve returns.
RHS Financial. 4171 24th St. Suite 101 San Francisco, CA 94114