The Steamroller: Reflections from My First Black Swan
Investing is a numbers game. With a well diversified portfolio, you make a lot of little bets and on any given day some of them are winners and some of them are losers. In good times more of your bets are up than down, and in bad times at least some of your bets should pay off, cushioning the blow of a bad day or quarter or year.
And then there are those times when you get crushed by the steamroller.
The steamroller struck on February 5th, 2018. Here’s what it looked like.
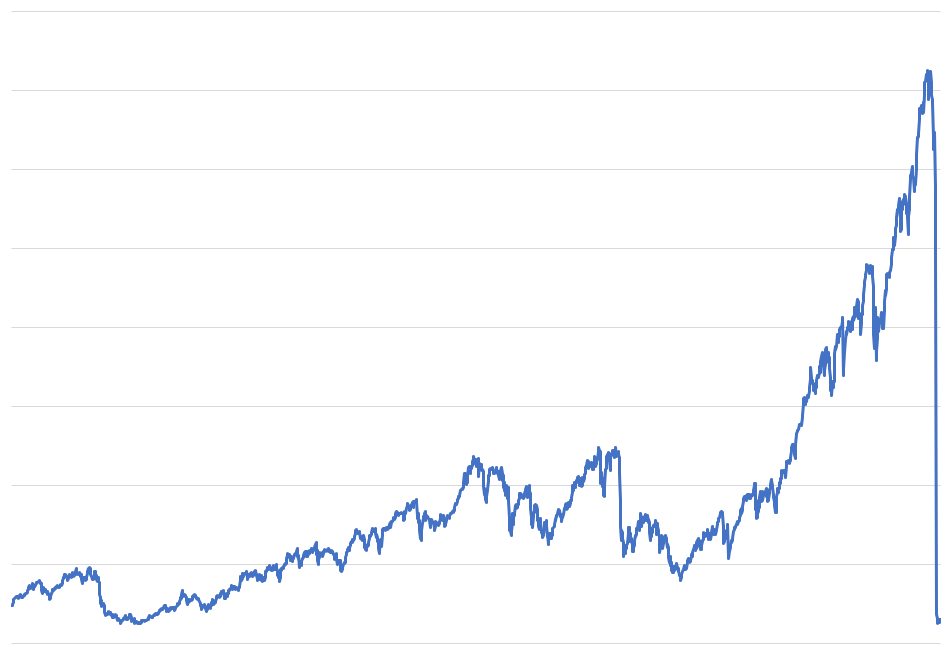
And then it continued to plow through the markets for the rest of the month and the first quarter of 2018.
Oh Snap!
The pullback snapped a record-breaking winning streak for the US stock market. The S&P 500 had had positive returns for 15 months and 9 quarters in a row going into February, with market volatility near all-time lows, something I commented on in a recent post. But following a sudden, sharp loss on Friday, February 2nd and the following Monday, volatility came roaring back and US stocks lost 3.69% in February and finished the quarter down 0.76%. Normally, these aren’t such bad numbers, but the problem was that everything else was also down at the same time. Not only did US stocks sell off, but so did international stocks, and government as well as corporate bonds, and gold, and commodity futures, and preferred and convertible securities, and emerging market debt, and even cryptocurrencies (though I wasn’t too surprised by that last one). This is uncommon; in fact looking at data back to 1973 I count only 16 months in which all major asset classes across stock, bond, and commodity markets were all simultaneously down like in February[note]Looking at monthly return data for the following indices: MSCI USA, MSCI World ex USA, LBMA Gold Price, S&P GSCI, ICE BofAML US Corporate, Barclays US Treasury[/note].
And all this in the middle of some of the calmest macroeconomic waters we’ve seen in years. Despite the market’s temper tantrum, there’s no sign of recession anywhere on the horizon. The economy is at or near full employment. The latest figures show industrial production, durable goods orders, and other economic indicators continuing to increase. Consumer confidence is near all-time highs. Inflation remains low and stable. There has, of course, been lots of talk about the possible negative ramifications of President Trump’s new tariffs, but those were announced on March 1st, after the the surge in volatility was already well underway. So what happened?
There’s a good case to be made that the recent spate of market volatility is at least in part the result of a runaway positive feedback effect – a liquidity spiral – that got tripped in a complex of derivatives markets surrounding an index known as the VIX in early February. That previous sentence probably looks like gobbledygook to most of you so let me break it down.
A VIXing Problem
The CBOE S&P 500 Volatility Index, aka the VIX, aka the Fear Gauge, is a financial indicator closely watched by financial professionals and mostly unheard of by everybody else. It’s a number that’s supposed to represent the market’s expectation of the S&P 500’s annualized volatility over the next month. Got that? So a number of 15 would indicate that the market is expecting that over the next 30 days prices on the stock market will bounce around at a rate of standard deviation that when annualized equals 15%. How do they get that number? From a composite of prices on call and put options on the S&P 500 that are continuously updated using some complicated mathematics. The long-run average value for the VIX is about 18.5, which is pretty close to the actual volatility over the same period.
Having a market forecast for volatility was at first just an academic exercise. But it didn’t take market participants long to realize that the VIX could have interesting properties for hedging or speculating as well. Investors everywhere are of course concerned with volatility, and would prefer to reduce it all else equal. Plus, volatility typically increases as market prices are falling. People often sell in a panic, but they rarely buy in a panic. So an investor who could go long the VIX, and profit from an increase in its value, would have an asset that tended to go up when everything else was falling, offering the potential to dramatically reduce risk. Indeed, changes in the VIX are strongly negatively correlated with changes in the S&P 500, offering great hedging potential. Effectively, insurance against a market crash.
In order to buy that insurance someone would need to sell it to you. Why would anyone do that? The same reason any business sells insurance: they expect to charge you for it and make money most of the time. If you wreck your car, or your house catches on fire, your insurance company loses money on you, but as long the claims aren’t too frequent and don’t all come at once selling insurance can be a good business. The problem comes when there’s a wildfire and everyone’s house catches on fire at once. Then a consistently profitable insurance company can suddenly find itself broke. Insurance profits are thus often characterized by this pattern of a long series of low but stable profits punctuated by sharp, extreme losses. Such extreme events have in recent years come to be referred to as “black swans” after the concept was popularized by Nassim Taleb’s famous 2007 book by the same name.
Many well-known investment strategies in the financial markets resemble this sort of payoff distribution as well, such as the currency carry trade, market making, and merger arbitrage. Because they all exhibit this characteristic of traders making small but consistent returns but experiencing occasional wipeouts these type of insurance-selling-like strategies are often colorfully referred to within the financial world as “picking pennies up in front of a steamroller.” And selling the VIX, insurance against a market meltdown, might be the quintessential version of that.
Now, because the portfolio of options that the VIX is derived from is constantly shifting, you can’t buy the VIX like you can effectively buy the S&P 500 though an index fund or ETF. But in 2004 the Chicago Board Options Exchange (CBOE) began trading in VIX futures: traded contracts that upon the maturity (delivery) date obligate the seller (the short) of the contract to pay the buyer (the long) some multiple of the value of the VIX. Because the price of the futures contract eventually converges on the VIX at maturity, it tracks its changes over the course of its traded lifetime, but the further out from maturity it is the more it will tend to trade at a premium above VIX. This is the compensation paid to the short for providing insurance to the market. Traders who wish to hedge their risk have to regularly buy expensive new VIX contracts as their depreciated old ones come due in a continuous cycle of buying high and selling low. Traders who short the VIX do the opposite.
Because most investors do not have access to the futures market, there are several funds and exchange traded products that offer individual investors access to the VIX futures market. One of the first and most popular is VXX, which was launched in early 2009 at the height of the financial crisis when demand for risk hedging was through the roof. How would an investment in VXX have done since then? Below I plot its performance since inception through February 2018 alongside the S&P 500 ETF (SPY) for comparison.
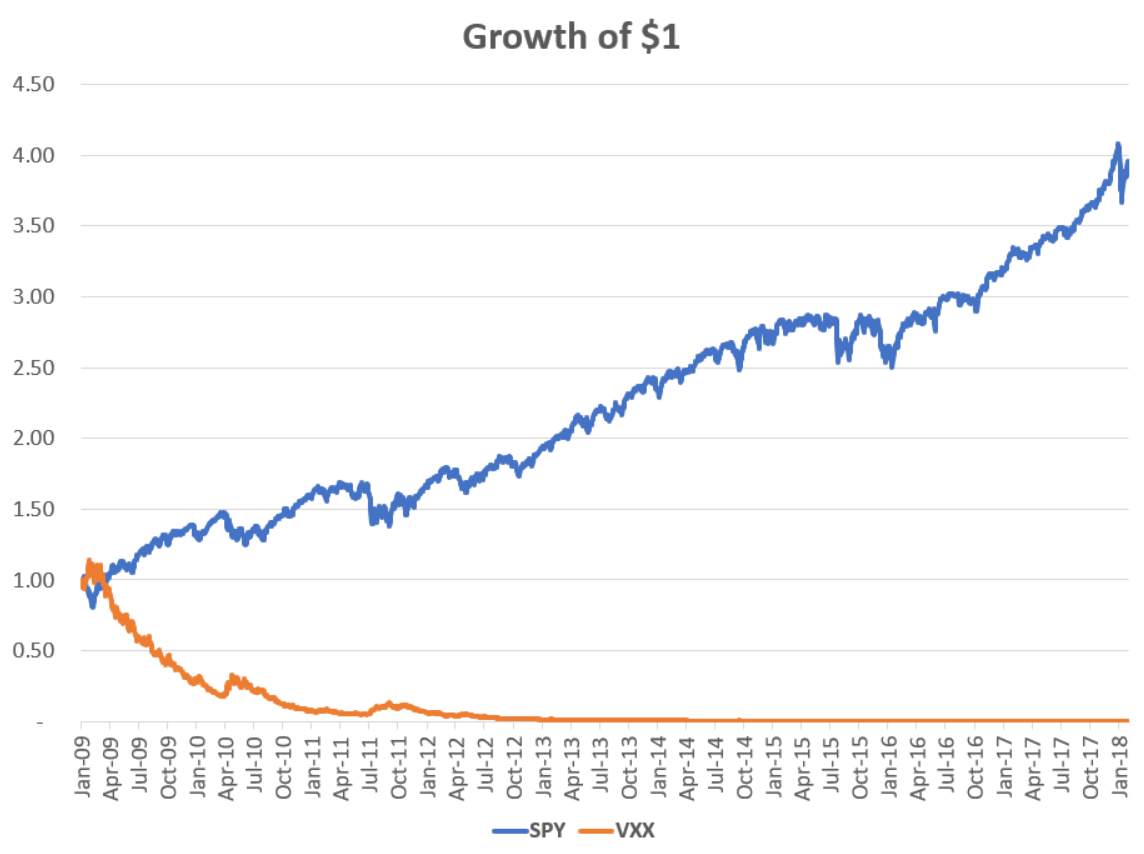

A couple of observations jump right out:
- VXX delivers on its promise as an excellent stock market hedge. It goes up when the market goes down. The correlation between the two is over this period is about -0.8.
- More obviously, VXX has been an absolutely terrible long-term investment. Early adopters of VXX would have looked brilliant for one brief, glorious month at the tail end of the financial crisis, but ever since then the thing has pretty much been a train wreck that never stops crashing. VXX has lost more than half of its value every year on average since 2009, reducing an initial $1 investment into a tiny fraction of a penny.
Now, VXX is an insurance policy, so we shouldn’t expect it to make money in the long run. But this seems a bit extreme. If you ever get to the point where you have to spend more than half the value of your car each year just to keep it insured you should probably start questioning your life choices. So yes, going long VIX is a great way to reduce risk, but it comes at tremendous cost. We can see this more clearly by comparing a buy-and-hold SPY investor to an investor who buys a portfolio holding 90% SPY and 10% VXX, rebalancing monthly (because I’m using monthly observations the results for SPY are slightly different than above):
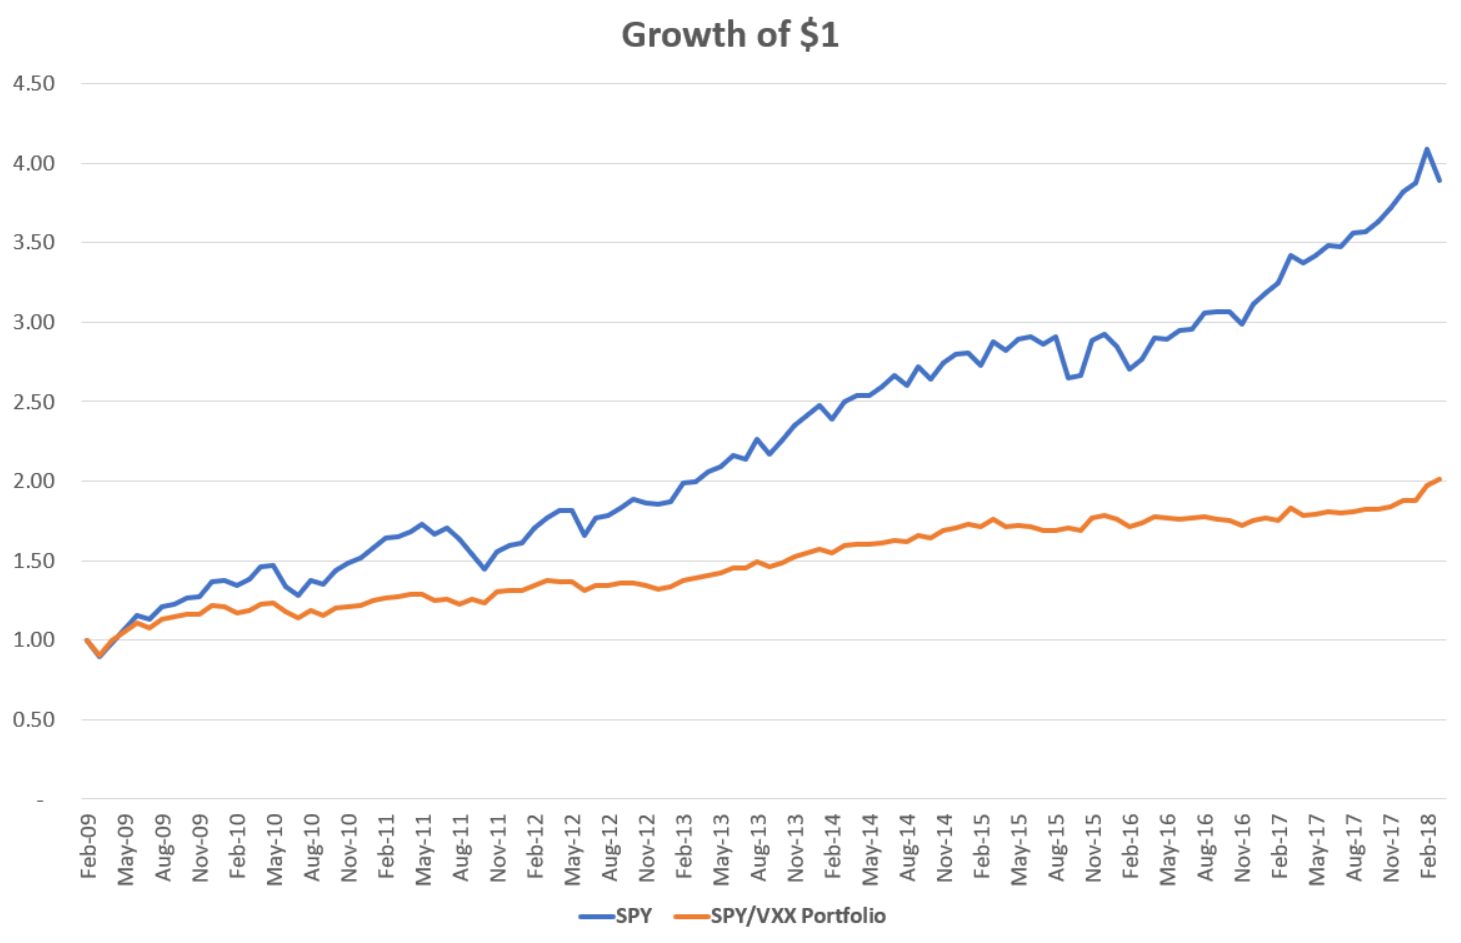
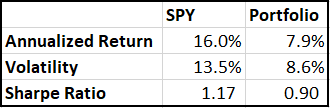
Adding a 10% position to VXX lowered volatility by about 36% over this period, but it cut the returns in half, resulting in a significantly worse return-to-risk ratio (Sharpe ratio). An investor looking to reduce her stock market risk would have been better off just setting aside some of her funds in cash rather than continuously hurling money into the black hole of VIX futures.
So if buying VIX futures is such a money loser, then shorting them must be great, right? You can start to see why picking up pennies in front of a steamroller might sound like an attractive proposition. Not long after the first long VIX products were released, issuers began offering ways to short the VIX as well. The most popular of these was distributed by VelocityShares, called XIV (that’s VIX backwards, someone must have thought they were clever), first listed in late 2010.
XIV was structured to be the mirror image of VXX, holding a short position in VIX futures contracts, and it had a couple features that will be critical to our story in a moment. First, because there’s no such thing as buy-and-hold when it comes to short-selling, short-sellers must regularly rebalance their position to maintain their allocation (if you allocate 100% of your capital to a short position, then as the asset’s price rises your short becomes more than 100% of your capital, as it falls it becomes less, whereas if you buy-and-hold an asset it will always be worth 100% of the allocated capital automatically). XIV was designed to use daily rebalancing, and would buy or sell contracts at the end of the day as necessary to adjust back to being fully allocated. Second, XIV was structured as an exchange-traded-note (ETN), as opposed to the more familiar exchange-traded-fund (ETF). ETNs do not actually hold any underlying assets (long or short), instead they are essentially IOUs issued by a bank whose worth is determined by the value of the asset they are linked to. They are effectively bonds then, and are subject to the credit risk of the issuer, unlike normal ETFs. To limit this risk ETNs often have buried in their fine print stipulations under which the issuer can cease trading in the security and call it in early. Credit Suisse was the guarantor of XIV, and though XIV technically didn’t hold any positions in VIX futures at all, Credit Suisse would trade VIX futures as necessary to hedge their position in XIV, which was their liability.
Before proceeding, it’s worth reflecting for a bit on all the layers of complexity a product like XIV is built upon. Here is an investment security that is a promissory note issued by a bank, securitized and chopped up into pieces and sold as shares on an exchange, whose value is based on a hypothetical index designed to track the value of a continuously traded portfolio of futures contracts, whose value in turn is derived from a hypothetical index designed to track the value of a continuously traded portfolio of options, whose value in turn is derived from a hypothetical index designed to track the value of 500 large US stocks. Understanding the recipe to this layer cake of securitization and derivatives should have given investors a hint as to what would ultimately be in store for XIV.
So what did investors get for taking the other side of the VIX trade? How much did all those pennies add up to? Below I plot the performance of XIV from inception through the end of January 2018, along with SPY for comparison.
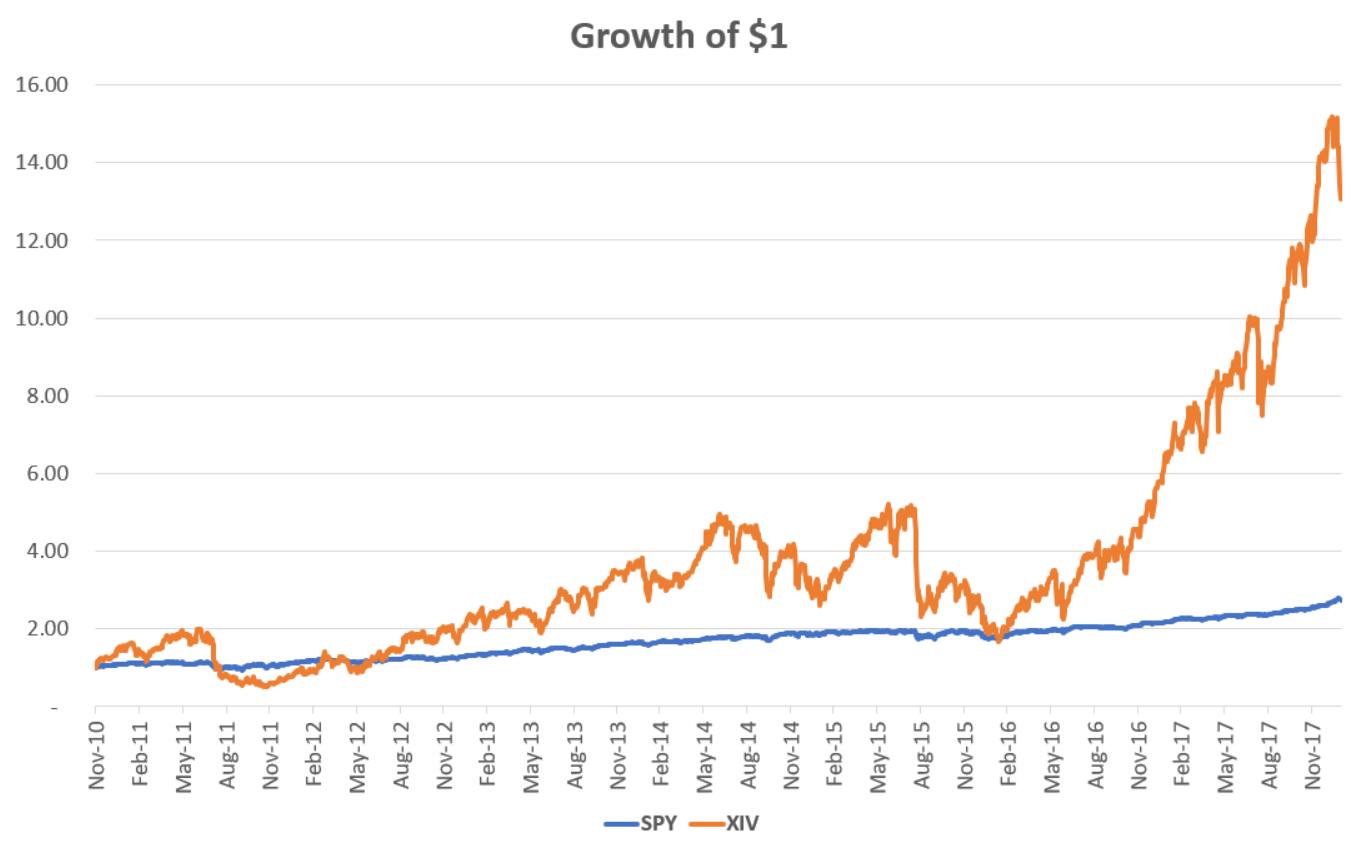
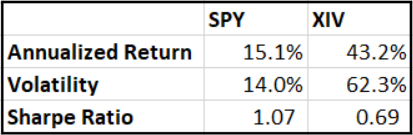
That’s a lot of pennies! It would have been a bumpy ride, but while buy-and-hold SPY investors would have not-quite-tripled their money over this period, buy-and-hold XIV investors would have increased their bankroll more than fifteen-fold at its peak. Investors willing to stomach a higher risk-to-reward ratio would have been able to juice their returns handsomely compared to investing in stocks.
But of course, you know what happens next, right? Here’s that same chart, now through the end of February.
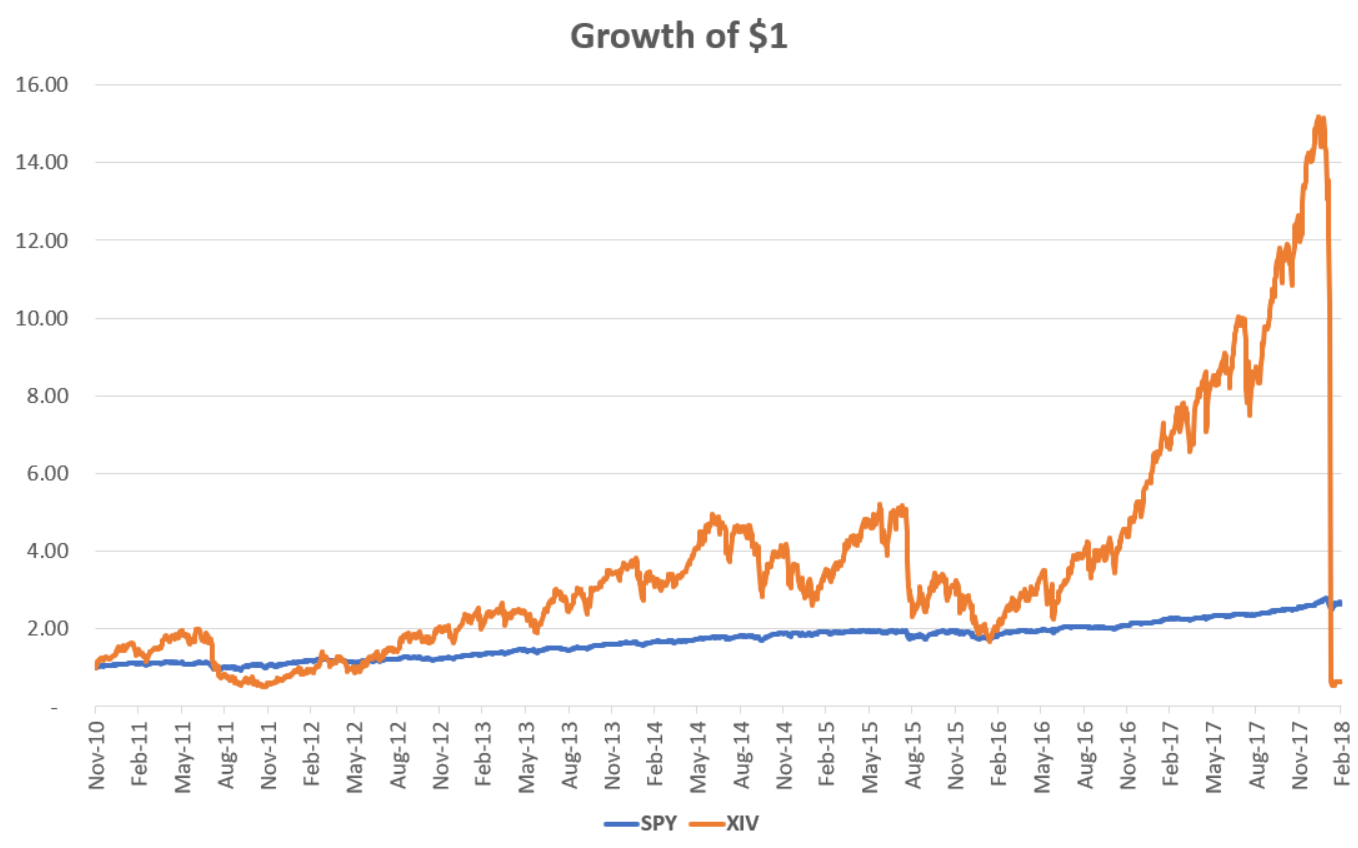
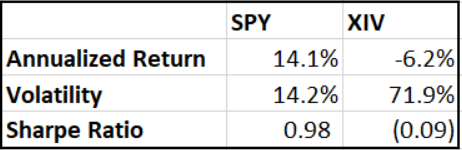
On February 5th, XIV closed at $99, already down about 30% from the previous week. When it began trading on February 6th, it opened at $10.49. Credit Suisse promptly announced they would call the security in early. On its final day of trading, February 15th, XIV’s closing price was $6.04, a 95% loss from the start of the month.
Ouch. What happened?
On the eve of its destruction, XIV had several billion dollars in assets under management. Other competitor ETFs and ETNs on both the long and short side had billions more as well. Like XIV, most of these products rebalanced their position on a daily basis, generally inside a short window in the hour or so following the close of the stock market (futures markets stay open pretty much 24/7). Thus Credit Suisse, along with a couple other major asset managers issuing these securities became the 800 pound gorillas in the VIX futures market, pushing hundreds of millions of dollars of order flow through the CBOE every afternoon.
On Friday, February 2, after a year of some of the calmest markets on record, the S&P 500 suddenly fell over 2%. The VIX jumped from a quite-low 13.47 to a more-normal 17.31. But though a VIX around 17 isn’t anything out of the ordinary, that represents a one-day increase of 28%. XIV, being short, thus lost a roughly comparable amount (not exactly because the futures on the VIX don’t necessarily track the VIX itself one-for-one). How did Credit Suisse respond to this shock? The way they were contractually obligated to, by buying back VIX futures contracts to bring their short position back to target, thus pushing futures prices up and, by way of arbitrage processes within the derivatives markets, pushing the VIX up further itself.
This spike clearly caught a lot of traders off guard, and over the weekend many of them decided they needed to reduce their risk exposures, whether by cutting back on their VIX exposure, selling stocks, or anything else they could get rid of in a hurry, whether to prevent margin calls from their brokers, or in anticipation of the fact that others would need to sell to prevent margin calls. In any case, when the markets opened on Monday, there was blood on the streets. Stocks were down over 4% in the worst single-day decline since the 2011 Eurozone crisis. Investors sold out of XIV and other short-VIX products en masse, and many others bought into long-VIX products in extremely high volumes. The VIX rose, although not as much as you might think throughout most of the day. XIV opened at $109.57 and closed at $99, a bad day for sure but hardly devastating. But then the stock market closed and something interesting happened. In order to accommodate these flows and rebalance back to par, the asset managers of these funds needed to buy VIX futures contracts on both the long and short side of the trade. In response to all the money flowing into VXX and other long-VIX products, managers had to buy more futures, and in response to money flowing out of XIV and other short-VIX products, as well as to reduce exposure from the day’s losses, managers had to buy more futures.
So what happens when a bunch of traders all show up at the same time and the same place demanding to buy several billion dollars worth of the same asset and to buy it RIGHT NOW? Well, if you’re the VIX, you double. In about an hour.
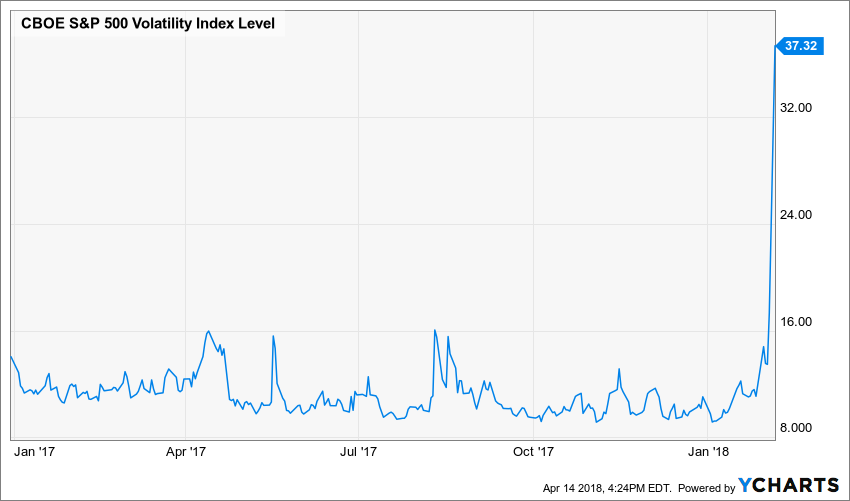
And so while the VIX opened at 18.44 February 5th, virtually identical to its historical average, it closed the day at 37.32, a one-day 102% increase and by far the largest move in its history, including even in the depths of the financial crisis.
So what happens when you’re short an asset that more-than-doubles? Mathematically, you now have negative money. In finance speak, you just blew up. Also, you’re probably fired.
Honestly it’s a little surprising to me that XIV didn’t go to literally zero, but I guess Credit Suisse was able to cover just enough of their position in time to save at least a few dollars, so instead XIV only lost 95% instead of 100%.
It only took a few days for the VIX to come back down to more-or-less normal levels again, but there was no possible hope for recovery for XIV. To see why consider the basic math of its design: while a doubling of the VIX took XIV from 99 to 5, because of the fact that it starts off every day with a clean slate, if the VIX then halves back down to its original level, XIV can only go back up to 10. Compound geometric returns are a cruel mistress, and they were the death of XIV. And so Credit Suisse threw in the towel.
Lessons
The VIX explosion cost investors billions of dollars in a shockingly short amount of time. Though I’m not aware of any hard evidence of this, it’s safe to assume that the event blindsighted many hedge funds and individual traders who, facing margin calls from their brokers and capital calls from their investors, would have been forced to sell anything and everything in their portfolio to immediately raise cash. These sorts of forced sales can have positive feedback effects that ripple through the rest of the financial system, as margin calls lead to forced sales lead to lower prices lead to falling equity lead to more margin calls lead to more forced sales, and so on.
(One example we do have on the record is of the hilariously titled LJM Preservation and Growth fund, a successful mutual fund which pitched itself as a more conservative way to invest in the stock market but lost 55.8% from its short-VIX position. The fund has since closed and if you Google it now the top results are for law firms that will be happy to help you sue them.)
These sort of positive-feedback blowups are not at all uncommon in the world of finance. The most famous example is probably Black Monday, October 19th, 1987, in which the US stock market fell more than 22% in a single day, despite the fact that no recession or other economic calamity ever materialized that year. It’s widely believed Black Monday was the result of runaway selling from new, computerized “portfolio insurance” strategies which would automatically sell stocks if they fell below certain levels. When stocks fell 4.6% the previous Friday, these programs were triggered to all start selling on Monday. The intense selling pressure pushed prices lower, which triggered more automated sales, etc.
Another great example is that of Long-Term Capital Management, an all-star hedge fund that, after quadrupling its money in four years with seemingly little risk, famously blew up in 1998 and had to be bailed out by a consortium of 16 different banks organized by the Federal Reserve. The soundbite version of the LTCM story that has been repeated in the financial press ever since is that it is a cautionary tale of the perils of hubris and reckless risk-taking. But the truth is more nuanced. In fact, LTCM was extremely fastidious about its risk management, and had anticipated any number of economic worst-case-scenarios. LTCM pursued a wide variety of arbitrage trades, seeking to exploit tiny mispricings between related securities, such as between a government bond and an option contract on it, or between the same stock trading on two different exchanges. It diversified across hundreds of such trades, each of which were unrelated to the others, and sized its positions such that if any one – or several – of its trades blew up the overall portfolio would be fine. It even secured long-term financing deals to minimize the risk of receiving margin calls from their brokers, and only allowed investors to withdraw their money once annually. Despite all these measures, LTCM fell prey to the positive feedback effects of recursive forced selling and it was its undoing. In his book on the history of hedge funds, More Money Than God, Sebastian Mallaby points to LTCM’s success as their own undoing. Just as Credit Suisse became the 800 pound gorilla in the VIX market, LTCM’s success meant that they grew to the point that they were the dominant players in each of the trades they took part in. Not only that, but a plethora of copycat funds piled on as well, creating dangerously unbalanced market conditions. He writes:
Even though Long-Term shrouded itself in secrecy, routing its trades through multiple brokers so that none of them could understand its bets, an army of imitators had pieced together much of its strategy. The upshot was that LTCM’s large portfolio was mirrored by an even larger superportfolio created by its disciples, meaning that LTCM’s trades were monstrously crowded. By the spring of 1998, every bank or hedge fund that might buy LTCM’s positions had already followed [founder] Meriwether’s example and bought them; it a trade went wrong and Meriwether needed to retreat, there would be nobody to sell to. Moreover, the canny players on Wall Street could see what was going on. On the one hand, there was nobody left to buy LTCM’s positions, so there was no way they were going up. On the other hand, a shock that forced the arbitrageurs to sell would cause LTCM’s portfolio to collapse precipitously.
In August of 1998 that shock arrived in the form of the Russian sovereign debt default. Even though LTCM had no meaningful exposure to Russia, and even though its capital was diversified across a wide set of seemingly unrelated bets, other traders who held similar positions as LTCM did have exposure to Russia, and the shock forced many of them to start to unwind their positions in order to raise cash. You see where this is going… as traders unwound their positions to meet margin calls, prices moved against LTCM and its copycats, forcing yet more traders to unwind their positions to meet margin calls, pushing prices away further still. Suddenly, price relationships that previously had nothing to do with each other – the difference between the price of Royal Dutch Shell trading in London versus Amsterdam, the difference in yield between recently issued and seasoned treasury bonds, the spread between the price an acquisition was announced to take place at and its current stock price – all began to behave the same way. Because LTCM had been so careful they were able to weather the storm much better than most hedge funds would have, but after losing billions of dollars in a matter of months they were finally crushed by the steamroller.
I imagine those of you who are not immersed in the world of hedge funds and derivatives trading might be feeling a bit exasperated at this point. “Why do we keep doing this?! Why do we keep letting Wall Street hold the world hostage while they play hot potato with ticking time bombs?! Do we really need securitized debt on derivatives of derivatives? What good does any of this stuff do for the world?” I imagine you shouting unto the heavens, fists clenched and raised high above your head.
This tends to be the popular reaction whenever there’s a major blowup like this, and the XIV debacle is proving no different. Credit Suisse was selling “grenades” according to Bloomberg; it was “crazy” they were allowed to sell it in the first place, says Vox; and now here come the lawsuits, of course.
But this is not the lesson I want to draw from this episode. On the contrary, the reason I am writing about all of this is in order to say the following: Yes, exotic financial instruments like these can be risky and occasionally cause financial panics and No, we cannot get rid of them. We actually do need securitized derivatives of derivatives and all other manner of Wall Street alchemy. This is the world we have built and there’s no escaping it. So long as we live in a modern, technologically advanced civilization it could not possibly be any other way. Our only choice is to embrace the steamroller.
In this post I have been explaining how positive feedback loops in financial markets can go wrong. But these same phenomena are the very reason humankind was able to bootstrap civilization off the ground in the first place. If you are at all like me, dear reader, you do not farm or hunt your own food. You do not sew your own clothing or pick the cotton or shear the wool that it is made from. You did not build your own house or find the fuel that keeps it warm and well lit. You do not do any of these things because you believe that as long as you have money you can convince other people to do them for you. That is, as long as you can transfer title to securitized notes representing derivatives on green pieces of paper that were once derivatives on yellow pieces of metal. And this whole system works because everyone believes the system will work because everyone else believes the system will work. Like a room full of people all simultaneously sitting in each others’ laps, the system all at once seems to defy natural law, but is a stable equilibrium if done right, but is prone to sudden, utter collapse if too strongly disturbed.
The cost of participating in modern society is living with the steamroller, and in times past that was a much riskier proposition. The classic example of a black swan/steamroller type event, of course, is a run on the bank, a problem that plagued early modern society and would occasionally leave communities devastated. But as financial markets develop they tend to fortify their inner core and push the steamroller out to the periphery. Bank runs are now largely a thing of the past in developed economies, and the ones left to contend with the steamroller are hedge funds and other sophisticated investors who at least may better understand the sorts of risks they are taking.
That said, there is of course a difference between prudence and recklessness, and each black swan event like this offers the opportunity to make finer distinctions between the two. A reasonable person may trust in their local grocery store and the globalized system of trade in agriculture behind it, but still keep some canned food and bottled water in their basement just in case. While some investors obviously underestimated the risks of XIV and other VIX products, many others knew that exactly this sort of thing was possible and behaved accordingly, using good old fashioned diversification and rebalancing.
What would responsible use of XIV have looked like? Above I showed the performance of adding a 10% allocation to VXX, rebalanced monthly. Below I repeat the same exercise with XIV. Again, the switch to monthly observations changes slightly some of the statistics.
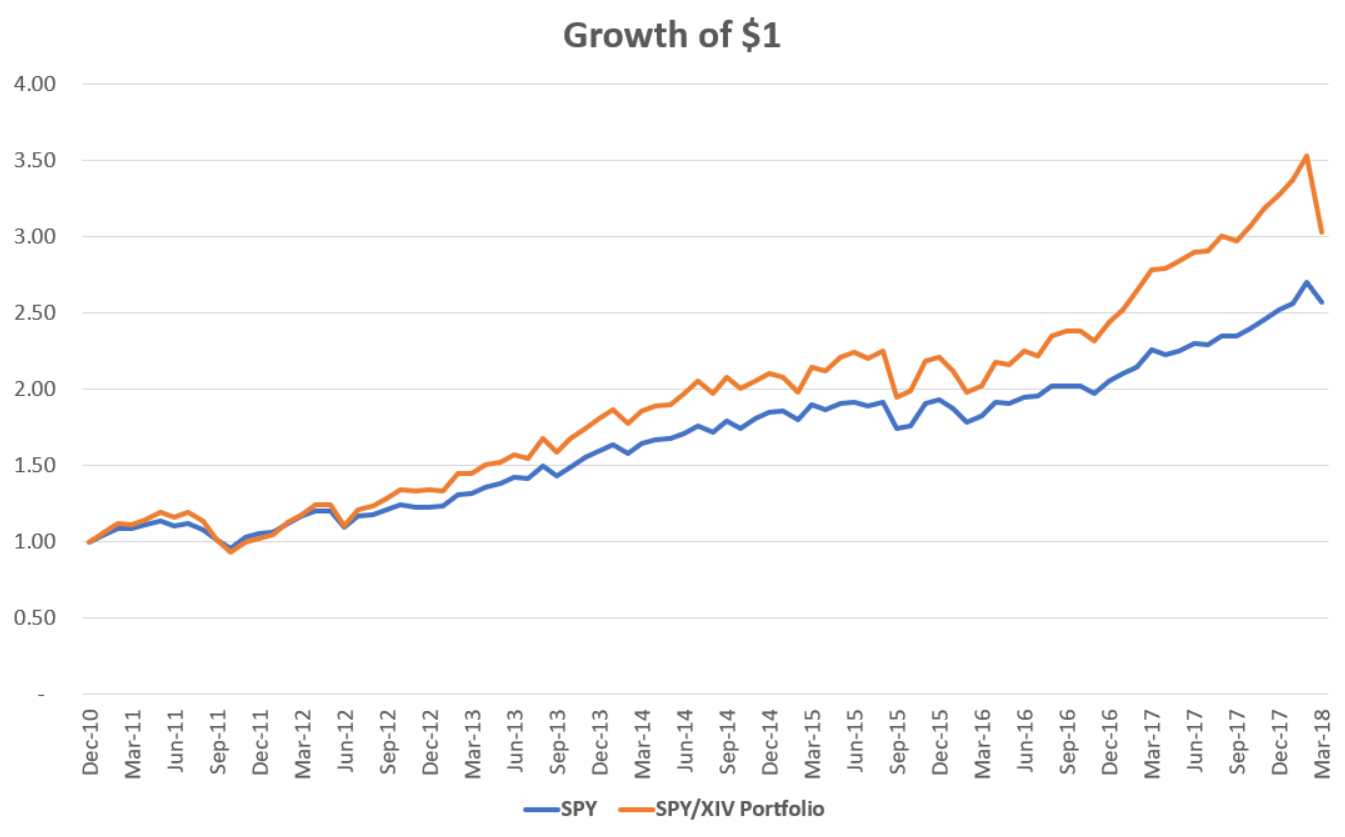
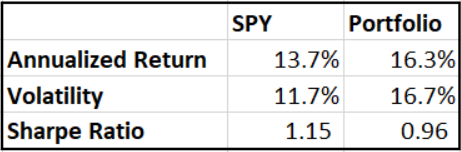 Not too shabby. By following this very simple strategy, my above claim that “Investors willing to stomach a higher risk-to-reward ratio would have been able to juice their returns handsomely compared to investing in stocks” remains true, even after the February blowup, which now looks less like “crushed by a steamroller” and more like “a pretty bad month.” By following any of a number of more sophisticated strategies, rebalancing based on a more nuanced estimation of risk and return, investors could have potentially done even better with XIV. In any case, for long-term oriented investors who measure their success over the course of decades, a small allocation to short-VIX or similar investments may have been and continue to be a reasonable bet to take.
On the other side of the trade, while I ridiculed the use of long-VIX products as a long-term investment vehicle, in all fairness that was never its intended use case. The primary audience for these strategies are sophisticated institutional investors making high-frequency adjustments to hedge their risks from engaging in essential activities like market-making. The widely celebrated fact that investors everywhere can now buy a widely diversified basket of stocks at close to zero cost is due to the fact that there is a large and competitive industry of market-makers and other liquidity providers who can very effectively hedge their risks thanks in part to innovations like VIX futures.
With that in mind, we can reframe what happened in February like so: in response to an unanticipated shock, short term traders providing the market with essential liquidity filed an insurance claim and received payment from long term investors providing the market with essential capital. The process didn’t go as smoothly as we might have hoped and there is probably room for improvement, but all in all this is how it should be. Long-term investors can and should be able to easily absorb a bad month, and it will probably look like a blip in the rearview mirror. For the intelligent investor, the steamroller stings, but it doesn’t kill you. You pick yourself up, dust yourself off, and get back to picking up all those shiny pennies.
Disclosure: I and many clients of RHS Financial held positions in XIV.
This post is solely for informational purposes. Past performance is no guarantee of future returns. Investing involves risk and possible loss of principal capital. No advice may be rendered by RHS Financial, LLC unless a client service agreement is in place. Please contact us at your earliest convenience with any questions regarding the content of this post. For actual results that are compared to an index, all material facts relevant to the comparison are disclosed herein and reflect the deduction of advisory fees, brokerage and other commissions and any other expenses paid by RHS Financial, LLC’s clients. An index is a hypothetical portfolio of securities representing a particular market or a segment of it used as indicator of the change in the securities market. Indexes are unmanaged, do not incur fees and expenses and cannot be invested in directly.
2024 Disclosures
RHS Financial is an SEC registered Investment Advisory Firm and distributes this presentation for informational purposes only. This presentation ( hitherto referred to as the presentation throughout this disclosure), blog post, infographic, slide deck or whatever form of informational modality the reader wishes to describe this as is provided for informational purposes only and should not be construed as investment advice in any way.
We believe the information, including that obtained from outside sources, to be correct, but we cannot and do not guarantee its accuracy in any way. RHS Financial uses information from outside sources to develop graphs, charts, infographics, etc. to enhance this presentation and while we believe the information from these outside sources, to be correct, we cannot and do not guarantee its accuracy in any way,
Any opinions or forecasts contained herein reflect the subjective judgments and assumptions of the authors who may be employees of but do not necessarily reflect the views of RHS Financial as a company. There can be no guarantee that developments will play out as forecasted. The information in this presentation is subject to change at any time without notice. This presentation contains “forward-looking statements" concerning activities, events or developments that RHS Financial expects or believes may occur in the future. These statements reflect assumptions and analyses made by RHS’s analysts and advisors based on their experience and perception of historical trends, current conditions, expected future developments, and other factors they believe are relevant. Because these forward-looking statements may be subject to risks and uncertainties beyond RHS Financials’ control, they are no guarantees of any future performance. Actual results or developments may differ materially, and readers are cautioned not to place undue reliance on the forward-looking statements. In a nutshell; these are our best guesses and please don’t assume they are fact.
Mentions of specific securities, investment products, investment indices, companies or industries should not be considered a recommendation or solicitation. Data and analysis does not represent the actual or expected future performance of any investment or investment product Index information is used to illustrate general asset class exposure, and not intended to represent performance of any investment product or strategy.
This post may contain references to third party copyrights, indexes, and trademarks, each of which is the property of its respective owner. Such owner is not affiliated with RHS Financial and does not sponsor, endorse or participate in the provision of any RHS’ services, or other financial products. Index information contained herein is derived from third parties and is proffered to you unaltered as we derived it from the third party.
RHS Financial, LLC is a Registered Investment Adviser. Advisory services are only offered to clients or prospective clients where RHS Financial, LLC and its representatives are properly licensed or exempt from licensure. This presentation is solely for informational purposes. Past performance is no guarantee of future returns. Investing involves risk and possible loss of principal capital. No advice may be rendered by RHS Financial, LLC unless a client service agreement is in place.
If the client is deemed suitable and agrees, RHS may employ leveraged strategies for these clients. Leverage attained through margin on a client’s account can add additional risk. While RHS tends to seek to improve return with theses strategies by applying leverage to less risky indexes, there is no guarantee that that RHS will lower risk or improve returns.
RHS Financial. 4171 24th St. Suite 101 San Francisco, CA 94114