The COVID-19 Bear Market: Observations and Opportunities
Soooo… I think we can all agree these last few weeks have not been a fun time to be an investor navigating the COVID-19 bear market and a human being living on earth. The novel coronavirus – a word most of us didn’t know the meaning of two months ago – has emerged as a global pandemic with deadly ferocity the likes of which we probably haven’t seen since the Spanish Flu over a century ago. I am writing this from my house in San Francisco, where I have been ordered to stay inside by my city and state government for about three weeks. While San Francisco and California were relatively early in issuing shelter-in-place ordinances, more than half the world’s population is now under lockdown as part of the effort to slow the spread of this virus.
A Bad Way to Start a Decade
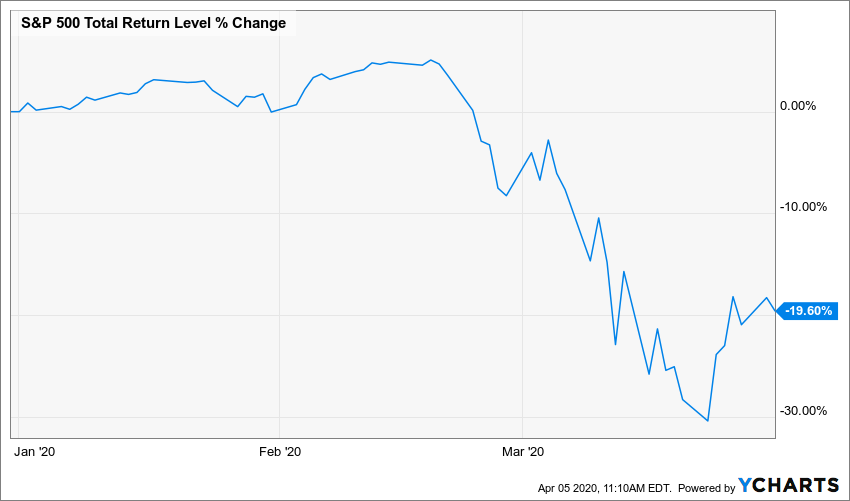
It’s unfortunately clear at this point that the COVID-19 disease will be a humanitarian disaster comparable to a major war, with likely over a million deaths around the world this year as a result of it. This is with the dramatic social distancing efforts that have been put in place in response to the pandemic. Without them, the toll could perhaps be in the tens of millions, as the Spanish Flu was. The virus and our efforts against it have now also brought about an economic disaster as well. Though the official data isn’t in yet, it’s universally recognized we are now in a deep recession worldwide. In the last two weeks 10 million Americans have filed for unemployment, a surge in claims that unlike anything we’ve seen before in history. And of course, the US stock market ended its historic 11 year bull market run, dropping more than 30% between mid-February and mid-March to finish the 1st quarter down about 20%.
A 20% loss in one quarter is bad enough, but the violence with which the sell-off occurred was truly historic. On Thursday, March 12th the S&P 500 closed down 9.49%, the worst day since Black Monday, 1987, and the 5th worst day on record. The next day it went up 9.32%, one of the best days ever. The following Monday it was down again even worse, 11.98%, the third worst day in history, just shy of the first day of the stock market crash in 1929. These wild swings go beyond even what we saw in the financial crisis a decade ago and hearken back to the Great Depression. Here’s one way of visualizing the COVID-19 bear market volatility, looking at average daily moves over 25-day windows:

These moves mean the speed with which losses have piled up has been breathtaking. As mentioned, US stocks lost just over 30% before recovering some. Using the (admittedly arbitrary) 30% cutoff, this is the fastest the market has ever gone down so much, taking only 22 days.

All these comparisons to the Great Depression might be making your nervous, so let me make the case for some cautious optimism. I have to admit, I was rather taken aback by how violently the market did react in March as news of the virus unfolded. This is because I know my market history pretty well, and knew that even if the coronavirus gets as bad as the 1918 Spanish Flu, financially speaking the Spanish Flu was not that big a deal. Between January 1918 and December 1920 the Spanish Flu infected roughly a quarter of the world’s population and killed anywhere from 17 to 100 million people. Here’s what US stocks were doing during that catastrophe.

They were up! Stocks were actually up during the Spanish Flu pandemic, by about 6.7% annualized over the three year period of the outbreak. Granted they were down a bit for the latter half of the period, but once 1921 rolled around and the flu subsided we of course began the roaring ’20s, one of the truly great bull markets of all time.
There are a couple important differences between what was going on during the Spanish Flu era and what’s happening now with coronavirus and the COVID-19 bear market, but first let’s linger on why the financial experience from the Spanish Flu shouldn’t be that surprising. Theoretically, in an efficient, rational market, the prices of stocks are determined by the value of all future dividends they will pay out till the end of time, discounted back to the present using an appropriate interest rate. In a growing economy, probably the most important variable determining this calculation is the rate of trend growth of dividends, which we might proxy as something like long-term GDP growth. But pandemics, like wars and natural disasters, generally have basically no effect on this, our capacity to increase our productivity as time goes on. They instead represent a one-time setback, a haircut to current output, that can quickly be made up for once things have returned to normal. In an ideal market then, plagues and other disasters should have little to no effect on the valuations of stocks and other assets. This seems to have been what happened during the Spanish Flu, and is what we very often see throughout history and around the world looking at markets following wars and natural disasters.
Animal Spirits and Infinite Money
So what’s different with the COVID-19 bear market? Basically, stress and panic. By stress, I mean financial or credit stress. During the Spanish Flu or any other modern pandemic, we did not see nearly the level of extreme social distancing measures practiced as we are now. The economy was more or less allowed to function normally. This probably cost tens of millions of lives ultimately with the Spanish Flu, but it did mean that businesses and households were mostly able to pay their debts on time and such so there was no wave of cascading bankruptcies. Today, much of the global economy is in a medically-induced coma and cashflows in several major industries have just stopped altogether. Again, in theory, this is fine. It need not have any effect on our long-run real economic capacity once things are up and running again. But in the meantime, there are thousands of corporations large and small that are at risk of defaulting on their debts, and millions of households at risk of failing to make their mortgage, rent, or credit card payments. If this is allowed to unfold unchecked, it could result in the domino effect of defaults that could truly devastate the markets and the economy and leave it in shambles for years after the virus has subsided.
This sort of unmitigated credit disaster is exactly what happened during the Great Depression, and the good (ish) news is that governments and central banks around the world have mostly learned from that event and other financial crises like the last one in 2008 and are already taking extraordinary steps to ease credit conditions in the economy. In a way the 2008 financial crisis laid the groundwork for the Federal Reserve and other central bank responses to the current crisis. When conventional monetary policy tools failed to halt the crisis in 2008, the Federal Reserve began conducting “quantitative easing” measures, buying bonds using money created from thin air. This was controversial at the time and many observers were concerned that “printing money” in such a way risked causing runaway inflation, even as the economy was falling into deflation. QE was therefore rolled out in limited steps in a way that was probably not up to the scope of the crisis at hand, and this may be why the recovery was so slow initially (although it was much better than in the Great Depression, when the Fed did nothing of the sort). It wasn’t until September 2012 that the Fed announced an “open-ended” round of QE, dubbed “QE Infinity”, meaning the Fed would pump as much money into the financial system as it took for as long as it took to return to normal again. It was only after this that the recovery really gained momentum and unemployment dropped below elevated levels, all while inflation remained low and stable.
This time, it only took a couple of weeks into the crisis for the Fed to go all in, announcing Unlimited QE on March 23. This included a commitment to buy corporate bonds for the first time ever, and there is talk of them buying other distressed assets to support the economy. These measures, combined with stimulus spending from the government, should stem the worst effects of a credit crisis and the COVID-19 bear market, though we will still undoubtedly see a surge of personal and corporate bankruptcies in the coming weeks and months.
That’s stress, the other difference I mentioned is panic, by which I mean animal spirits, the non-rational forces of investor sentiment that push markets to and fro. As I’ve mentioned many times previously on this blog, the US stock market for the last several years has been trading at historically elevated valuations, buoyed by an economy that seemed it could do no wrong. On the eve of the COVID-19 bear market, my favorite valuation metric, the CAPE (cyclically adjusted price to earnings) ratio was about 31 for the S&P 500, placing it in about the 93rd percentile of its history since 1950. Markets trade at all-time high valuations when basically everyone is feeling optimistic about them, and in those circumstances, they potentially have a long way to fall once pessimism starts setting in. Here is the evolution of the CAPE ratio of the S&P 500 since 1950. Notice the significant down-tick at the end there bringing us to the present.

As of the end of March the CAPE ratio is now 24.6 per Research Affiliates, putting it at about its 75th percentile since 1950. So, definitely no longer in “all-time high” territory but still not exactly cheap either. Unfortunately, US stocks would have to fall quite a bit further before they appeared to be a bargain by conventional valuation measures.
This is in stark contrast to the Spanish Flu episode. The Spanish Flu, of course, coincided with the end of World War I; markets around the world had already been depressed and there was lots of catch-up growth opportunities available. The CAPE ratio back then was in the single digits, something we haven’t seen since the early ’80s. Despite how catastrophic the influenza pandemic was, markets were already so low they just couldn’t really sink any lower. Everybody was pessimistic and so the only direction left to go was up. Legendary investor Benjamin Graham referred to this notion as the “margin of safety.” If there is a notion of the “intrinsic value” of a company, there is only so far its price can fall below that before it becomes immediately profitable for large investors or companies to acquire it whole, if only to liquidate its assets. The higher the premium the market places on a stock’s earnings or assets, the less its margin of safety and further it can fall in a panic.
This may not sound like good news for US stocks, and perhaps not. There is still a long way to fall before we’re back to “average” valuations. But it’s mostly only the US market that has been trading at these elevated valuations. Around the rest of the world, stocks which were just months ago trading at mostly average or fair valuations now look like bargains. The EAFE, the index of developed market stocks in Europe and Australasia, is now trading at a CAPE ratio of 13.4, just slightly above where it was at the bottom of the financial crisis in March 2009 when it was 11.2. Emerging market stocks are actually even cheaper right now than they were at the bottom of the financial crisis! 10.9 now vs. 12.7 then.
China, by far the largest of the emerging markets, provides an interesting case study here. Despite the coronavirus having emerged from within China, the Chinese market has somewhat ironically been one of the least hurt by it, suffering about half the losses as the US market year-to-date.
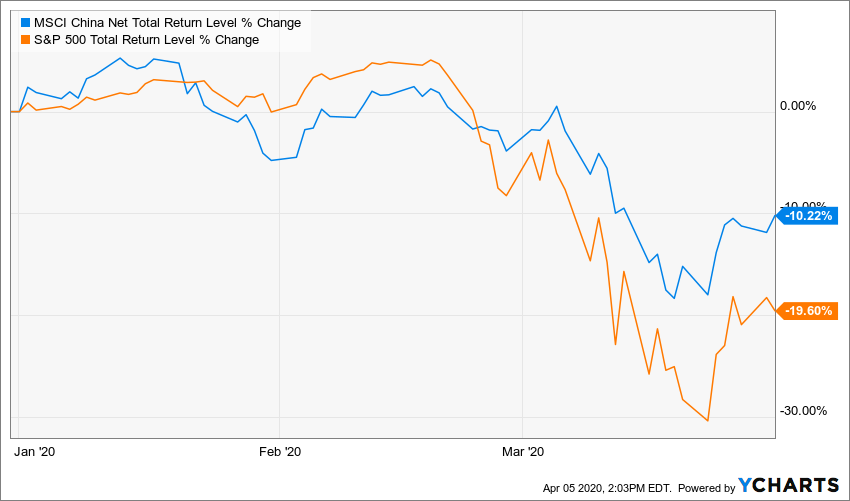
A good deal of this may be the very proactive (even draconian) measures the Chinese government has taken to control the spread of the virus. But it probably also just has to do with the fact that the Chinese market has a much greater margin of safety than the US market. The largest Chinese companies, as proxied by the FTSE China 50 index, now trade at a price-to-book ratio of about 0.94. Meaning that in theory, if every one of these Chinese giants liquidated all their assets, paid off all their liabilities, ceased operations, and paid all the proceeds to shareholders, the shareholders would reap an immediate 6% profit. Of course, there are all sorts of practical reasons why that wouldn’t work, but it does put a floor below how much further such valuations can plausibly fall short of truly apocalyptic scenarios. Generally, stocks (and especially entire stock markets!) trade at a premium to their book value (net assets) because presumably those assets are generating profits that will grow over time. The PB ratio on the S&P 500 right now, for example, is about 2.7. Again, lower than it was a few months ago, but still kinda high compared to history. By my count, the national stock markets than can now be acquired at a discount to their net assets includes China, Italy, Spain, Russia, Turkey, South Korea, and Poland. While the next few months may continue to be rough, it’s hard to see how such bargain assets won’t pay off in the coming years.
Outside stocks, there are other opportunities as well in the COVID-19 bear market. Many credit sectors were hard hit and now offer much higher yields than they have in years. Below I plot the yields over the last ten years for AAA rated corporate bonds (the highest rated), BBB rated bonds (the lowest rating that’s still considered “investment grade”) and BB rated bonds (the highest rating that’s considered “junk” or “high yield”). As you can see, early in the crisis, yields on all corporate debt spiked, but as the Fed announced unlimited QE, they quickly stabilized in the highest-grade segments.
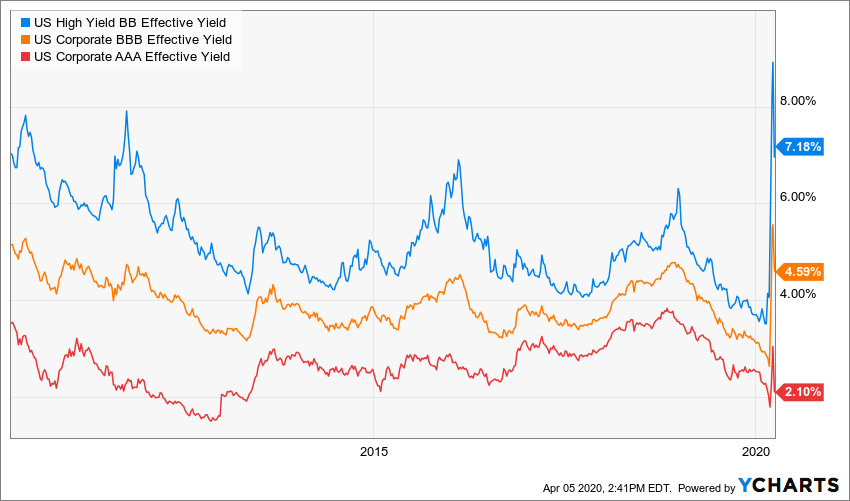
US High Yield BB Effective Yield data by YCharts
Overall, investment-grade corporate bond indexes are down only single-digit figures year to date, though yields are still somewhat elevated in the riskier sectors. High yield sectors are offering some of the highest rates we’ve seen in years. Many short-term high-yield bond ETFs, for example, now offer double-digit yields, and have experienced roughly half the volatility of stocks. Emerging market debt is also offering some of the highest yields we’ve seen since the financial crisis as well. These sorts of investments can hardly be considered “safe” but they may offer more margin of safety in terms of valuation than US stocks.
This Too Shall Pass
During challenging times like these, it’s important to remember that episodes like these are an inevitable part of investing. We’ve been here before, and we’ll be here again. But fundamentally, tragic though this pandemic and COVID-19 bear market may be, it will not take from us our knowledge of how to fabricate semiconductors, our ability to manufacture planes, trains, and automobiles, our capacity to build, innovate, and grow. Sooner or later it’s going to be safe to go outside again and we’ll get back to work, participating in a technologically advanced economy that picks up about where it left off. That’s what we’ve always done. Investing involves bouts of pain like this last month has been, but well-diversified portfolios almost always make money over decade-plus horizons. Now is not the time to make rash decisions that break away from your investment plan, although it may be time to be taking stock of where the best opportunities now lie. It’s also definitely time for me to go wash my hands again.
2024 Disclosures
RHS Financial is an SEC registered Investment Advisory Firm and distributes this presentation for informational purposes only. This presentation ( hitherto referred to as the presentation throughout this disclosure), blog post, infographic, slide deck or whatever form of informational modality the reader wishes to describe this as is provided for informational purposes only and should not be construed as investment advice in any way.
We believe the information, including that obtained from outside sources, to be correct, but we cannot and do not guarantee its accuracy in any way. RHS Financial uses information from outside sources to develop graphs, charts, infographics, etc. to enhance this presentation and while we believe the information from these outside sources, to be correct, we cannot and do not guarantee its accuracy in any way,
Any opinions or forecasts contained herein reflect the subjective judgments and assumptions of the authors who may be employees of but do not necessarily reflect the views of RHS Financial as a company. There can be no guarantee that developments will play out as forecasted. The information in this presentation is subject to change at any time without notice. This presentation contains “forward-looking statements" concerning activities, events or developments that RHS Financial expects or believes may occur in the future. These statements reflect assumptions and analyses made by RHS’s analysts and advisors based on their experience and perception of historical trends, current conditions, expected future developments, and other factors they believe are relevant. Because these forward-looking statements may be subject to risks and uncertainties beyond RHS Financials’ control, they are no guarantees of any future performance. Actual results or developments may differ materially, and readers are cautioned not to place undue reliance on the forward-looking statements. In a nutshell; these are our best guesses and please don’t assume they are fact.
Mentions of specific securities, investment products, investment indices, companies or industries should not be considered a recommendation or solicitation. Data and analysis does not represent the actual or expected future performance of any investment or investment product Index information is used to illustrate general asset class exposure, and not intended to represent performance of any investment product or strategy.
This post may contain references to third party copyrights, indexes, and trademarks, each of which is the property of its respective owner. Such owner is not affiliated with RHS Financial and does not sponsor, endorse or participate in the provision of any RHS’ services, or other financial products. Index information contained herein is derived from third parties and is proffered to you unaltered as we derived it from the third party.
RHS Financial, LLC is a Registered Investment Adviser. Advisory services are only offered to clients or prospective clients where RHS Financial, LLC and its representatives are properly licensed or exempt from licensure. This presentation is solely for informational purposes. Past performance is no guarantee of future returns. Investing involves risk and possible loss of principal capital. No advice may be rendered by RHS Financial, LLC unless a client service agreement is in place.
If the client is deemed suitable and agrees, RHS may employ leveraged strategies for these clients. Leverage attained through margin on a client’s account can add additional risk. While RHS tends to seek to improve return with theses strategies by applying leverage to less risky indexes, there is no guarantee that that RHS will lower risk or improve returns.
RHS Financial. 4171 24th St. Suite 101 San Francisco, CA 94114