
By Colby Davis, CFA
I should have known better.
After a banner year for markets in 2017, I declared at the start of this year that everything keeps getting better. But fate is a spiteful mistress, who does not abide mere mortals telling her how to behave. And so, as punishment, we had 2018, in many ways one of the worst years for markets on record. Sorry about that.
The Year That Nothing Worked
2018 has pretty much been a slow-motion train wreck for markets all year, though many casual observers didn’t notice until quite recently. As late as October 1st, the S&P 500 was up over 10%, a good haul to be sure. But since October stocks have tumbled significantly and as of December 14th the US market has entered negative territory, down -0.90% for the year.
A barely negative annual return on stocks isn’t normally anything to fuss about, but the US stock market has gotten off relatively easily this year. Many other markets are down substantially more, and most significantly, virtually no major asset class has made money this year. Below I plot the returns to 21 major asset classes from around the world across equity (green), bond (blue), and commodity (orange) markets, accounting for the vast majority of global investable markets.

No matter what you invested in in 2018, you almost certainly lost money. Nearly every asset class is down, including major international stock markets by 10% or more. Only three risky assets posted (barely) positive returns: the relatively small and illiquid senior loan, convertible debt, and municipal bond markets. And no market earned more than the risk-free asset, treasury bills. In other words, cash in a decent savings account at the bank outperformed everything else on earth in 2018. (By the way, I was going to include Bitcoin above, but with a staggering 77% loss this year, it would have overwhelmed everything else on the graph, not that I consider this to be a surprising development.)
This is all unusual. I mean, really unusual. Normally, when some asset classes are doing badly, other ones pick up the slack; that’s the whole point of diversification. Stocks, bonds, and commodities all have different fundamental economic characteristics to them that means they should respond differently to changing market conditions. If growth slows down, stocks will typically fall, but bonds will typically rise. If inflation picks up, bonds generally lose, but commodities generally win. So it’s extremely uncommon to see all categories move in the same downward direction together. Just how uncommon? Let’s focus on six major broad asset classes: US stocks, international stocks, treasury bonds, corporate bonds, high yield (junk) bonds, and commodity futures. Below I plot the annual returns to each of these assets on a stacked bar chart going back to 1970, as well as the average return among the six in the line plot.

As of December 14th, 2018 is the only year since 1970 in which every single one of these six major asset classes has had a negative return. We nearly saw it happen fairly recently in 2015 when the US stock market eked out a positive return by the skin of its teeth while everything else was down. But generally speaking, across this 49-year sample, even when some markets were crashing, at least one or two others were usually posting solidly positive numbers, such as in 2008 when treasury bonds rallied over 33% while the rest of the world was falling down around them.
If you held a portfolio with equal weights in each of these assets over this time, you would have earned a cumulative return of about 9.2%, just slightly lower than the US stock market by itself (9.8%) but with a lot less risk: that portfolio would have only lost money in seven of those forty-nine years, but 2018 would have been one of them, and right now it stands at the 4th worst return on record, at -4.5%, worse than the S&P 500 itself, making 2018 a particularly frustrating year for investors who do the smart thing and diversify, as it has lost them more money than if they had just stuck to the familiar held everything in the domestic stock market.
But Wait, it Gets Worse!
So far, we’ve only been talking about passive, market-wide returns on indexes: sources of return that in finance are often referred to as beta. Often, investors try to outperform these broad markets by picking the securities they think are the best within them. An investor might try to beat the S&P 500, for example, by buying those stocks within that market he thinks will outperform, and avoiding or even short-selling those stocks he think will underperform. These are sources of return often referred to as alpha. Now, most people who try to do this fail. But there are systematic, well-defined strategies that have succeeded over the long run, and that are often employed by sophisticated investors, especially in hedge funds.
There are a million and one such strategies that have been purported to work, but there are two in particular that I and many others have written about a great deal, that have a strong academic pedigree to support them, going back decades (or indeed even centuries), and that are broadly representative of the sort of strategies professional investors follow: these are value investing and momentum investing (aka trend-following). Value investing involves buying assets with relatively low fundamental valuations, such as stocks with low price-to-book or price-to-earnings ratios, and selling those with high (expensive) valuations. Momentum/trend-following entails buying assets that have been recently outperforming (over the time frame of a few months to a year) and selling those that have been underperforming. Below I plot the performance of a simple value and trend-following strategy implemented across a global sample of assets from 1985 through October 2018. These are long-short portfolios, meaning they have no net, long-term exposure to the underlying stock, bond, or commodity markets and so their returns are uncorrelated to them. I’ve rescaled the returns to match the volatility of the US stock market and included that index for comparison.

Adding exposure to value and momentum strategies over this period would have been a great benefit to investors over this time period. These strategies have earned positive returns (alpha) while being uncorrelated to sources of beta and negatively correlated correlated to one another. If we go back to our six-asset portfolio and average these two long-short strategies in as well, the results are even higher returns with lower risk, with only three down years since 1985.
But these time-tested strategies didn’t do anybody any favors in 2018. As of October 31st the hypothetical value and trend-following strategies above are down 8.4% and 7.3%, respectively. Adding them to the equal-weighted portfolio brings its year-to-date returns down to -5.3%, the single worst year on record besides 2008.
These data come from AQR, the second largest hedge fund manager in the world and one of the leading sources of academic finance research aside from a handful of top universities. (Full disclosure: RHS Financial uses AQR funds within its client portfolios.) How did these hypothetical portfolios translate into real-world performance this year? Here’s a sample of some of their publicly-available hedge funds returns this year.
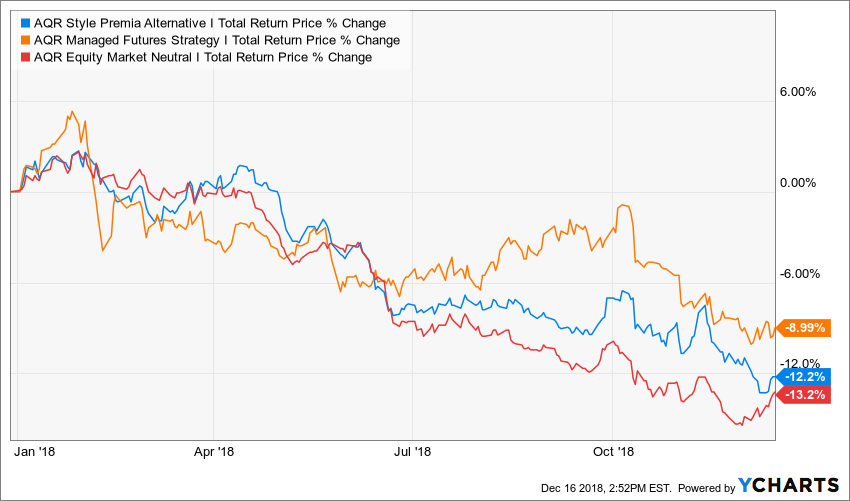
Ouch. They’re hardly alone, however. AQR is basically the Vanguard of hedge funds, and these strategies are broadly representative of hedge funds and active institutional investors in general. Most hedge funds are down this year, with most composite indexes down single digit or low double digit percentages, depending on methodology. In a year when every market was down, strategies that are not supposed to be dependent on the market are also down. Great.
What Happened in the 2018 market?
So around the world, across economically independent sources of alpha and beta, almost everything that has historically made money has instead lost money this year, in a manner that’s virtually unprecedented. Why?
Let me start with my standard disclaimer about trying to interpret market returns. “The market” is simply the sum total of all the financial decisions of billions of people around the world, all acting for their own reasons, with differing beliefs and objectives. Trying to weave a coherent narrative out of this chaotic stew of human experience is a bit of a Rorscharch test. Oftentimes the best explanation for why the market did whatever it did is just, “s#*t happens.”
That said, here are a few things that have been going on that to me seem like they might explain some of the insanity of this year’s market:
- Trade: This has of course been the major topic of economic news this year. President Trump has been raising tariffs on foreign goods aggressively, in a manner that hasn’t been seen since the end of WWII. While trade disputes seem to have deescalated among major US allies, relations with China, the second-largest economy in the world, are more strained now than they’ve been in decades. The spat is already disrupting major supply chains, and the increased uncertainty is making it more difficult for corporations to know how and where to invest. It’s still too early to tell, but there are early signs that the trade war is already causing a slowdown in both the American and Chinese economies. While there are plenty of legitimate concerns about China’s place in the international economy, there is virtually unanimous consensus among academic economists and financial professionals that the substantial increases in trade barriers passed this year will be harmful to the global economy, and the decline in share prices around the world is reflective of that. Tariffs often hurt even the narrow groups they are intended to protect. The worst performing asset class in my first chart above is also the most ironic: industrial metals prices. Since Trump announced 10% tariffs on aluminum, the metal, along with others like nickel and zinc, is down roughly 15%, a sign of weakening demand for building materials.
- Monetary Policy: The Federal Reserve has raised its target interest rate three times this year, and has adopted increasingly hawkish language when discussing the economy, focusing mostly on quelling any inflationary pressures before they rear their head. After years of raising rates slower than most people expected, the Fed has this year shifted gears and is now raising them faster than expected. The result has been a particularly bad year for bonds, as yields rise and prices fall. There is increasing concern that with the economy in an increasingly delicate state given the ongoing trade war that the Fed will overshoot in its efforts to “re-normalize” monetary policy after so many years of zero-interest-rates following the financial crisis and raise rates right into a recession. Just a couple weeks ago the treasury bond yield curve entered a partial inversion: a state in which longer term bonds sell at lower yields than shorter term bonds, an indication of liquidity stress in the financial markets and a potential harbinger of recession.
- Hedge Fund Outflows: Earlier this year I wrote a lengthy post about how an extreme event in the derivatives market known as VIX futures had caused a spillover effect in the rest of the financial markets, as it seemed that sharp losses suffered by certain financial market participants was causing traders to unwind their positions indiscriminately. These sort of liquidity spirals can cause previously unrelated markets to start behaving similarly for short periods as investors in them are forced to liquidate in the face of margin calls from their brokers or redemptions from their clients. Could something like this, playing out at a larger scale, explain the synchronized losses of this year? Maybe. The hedge fund industry has faced billions of dollars in outflows this year, and has been on average for three years now. Part of this is due to a probably-long-term trend of institutional investors like university endowments and pensions moving money away from high-cost hedge funds towards low-cost index-fund type investments, and some of it is probably short-term performance chasing as investors dump okay-performing hedge funds to pile into the US stock market after its years of meteoric performance. Hedge fund managers tend to be “smart money”, and play an important role in moving prices towards equilibrium, but in the face of waves of redemptions, they may become forced sellers and add to pricing inefficiencies. This could partly explain why many alpha strategies are down this year along with the rest of the markets in general.
The trillion dollar question of course is: so what? What do we do now after one of the across-the-board worst markets in modern history? The frustrating but probably-best answer is, “not much.” Looking at the past performance of diversified portfolios, years with bad performance were often (but not always) followed by years of good performance, and whether those returns came from stocks or bonds or something else is hard to predict. Like many other observers, I’ve been saying for a while now that US stocks look fairly expensive, and bonds around the developed world do as well, but it’s still unlikely that they’ll both fall in tandem, this year notwithstanding. If the economy does dip into recession, the Fed will be forced to reverse course and start lowering interest rates, which would likely cause a rally in high-quality bonds and possibly other safe-haven assets like gold. On the other hand, if trade disputes and other macroeconomic worries end up being resolved better or sooner than expected then stocks and other risky assets would probably rally on the news.
People often focus too much on recent news at the expense of longer term trends. The fact remains that most markets go up most of the time, but it’s very difficult to predict which ones will do better or worse year by year. Diversification remains the most reliable way to improve investment results; 2018 has just been an exceptionally bad example. Better luck next year!
Blogpost Disclosure
This presentation is solely for informational purposes. Past performance is no guarantee of future returns. Investing involves risk and possible loss of principal capital. Noadvice may be rendered by RHS Financial, LLC unless a client service agreementis in place. Please contact us at your earliest convenience with any questionsregarding the content of this presentation and how it may be the right strategy for you. For actual results that are compared to an index, all material factsrelevant to the comparison are disclosed herein and reflect the deduction ofadvisory fees, brokerage and other commissions and any other expenses paid byRHS Financial, LLC’s clients. An index is a hypothetical portfolio ofsecurities representing a particular market or a segment of it used asindicator of the change in the securities market. Indexes are unmanaged, do not incur fees and expenses and cannot be invested in directly.

