Economic growth has been kind of weird lately. We’ve just lived through the greatest economic crash followed by the strongest recovery on record.
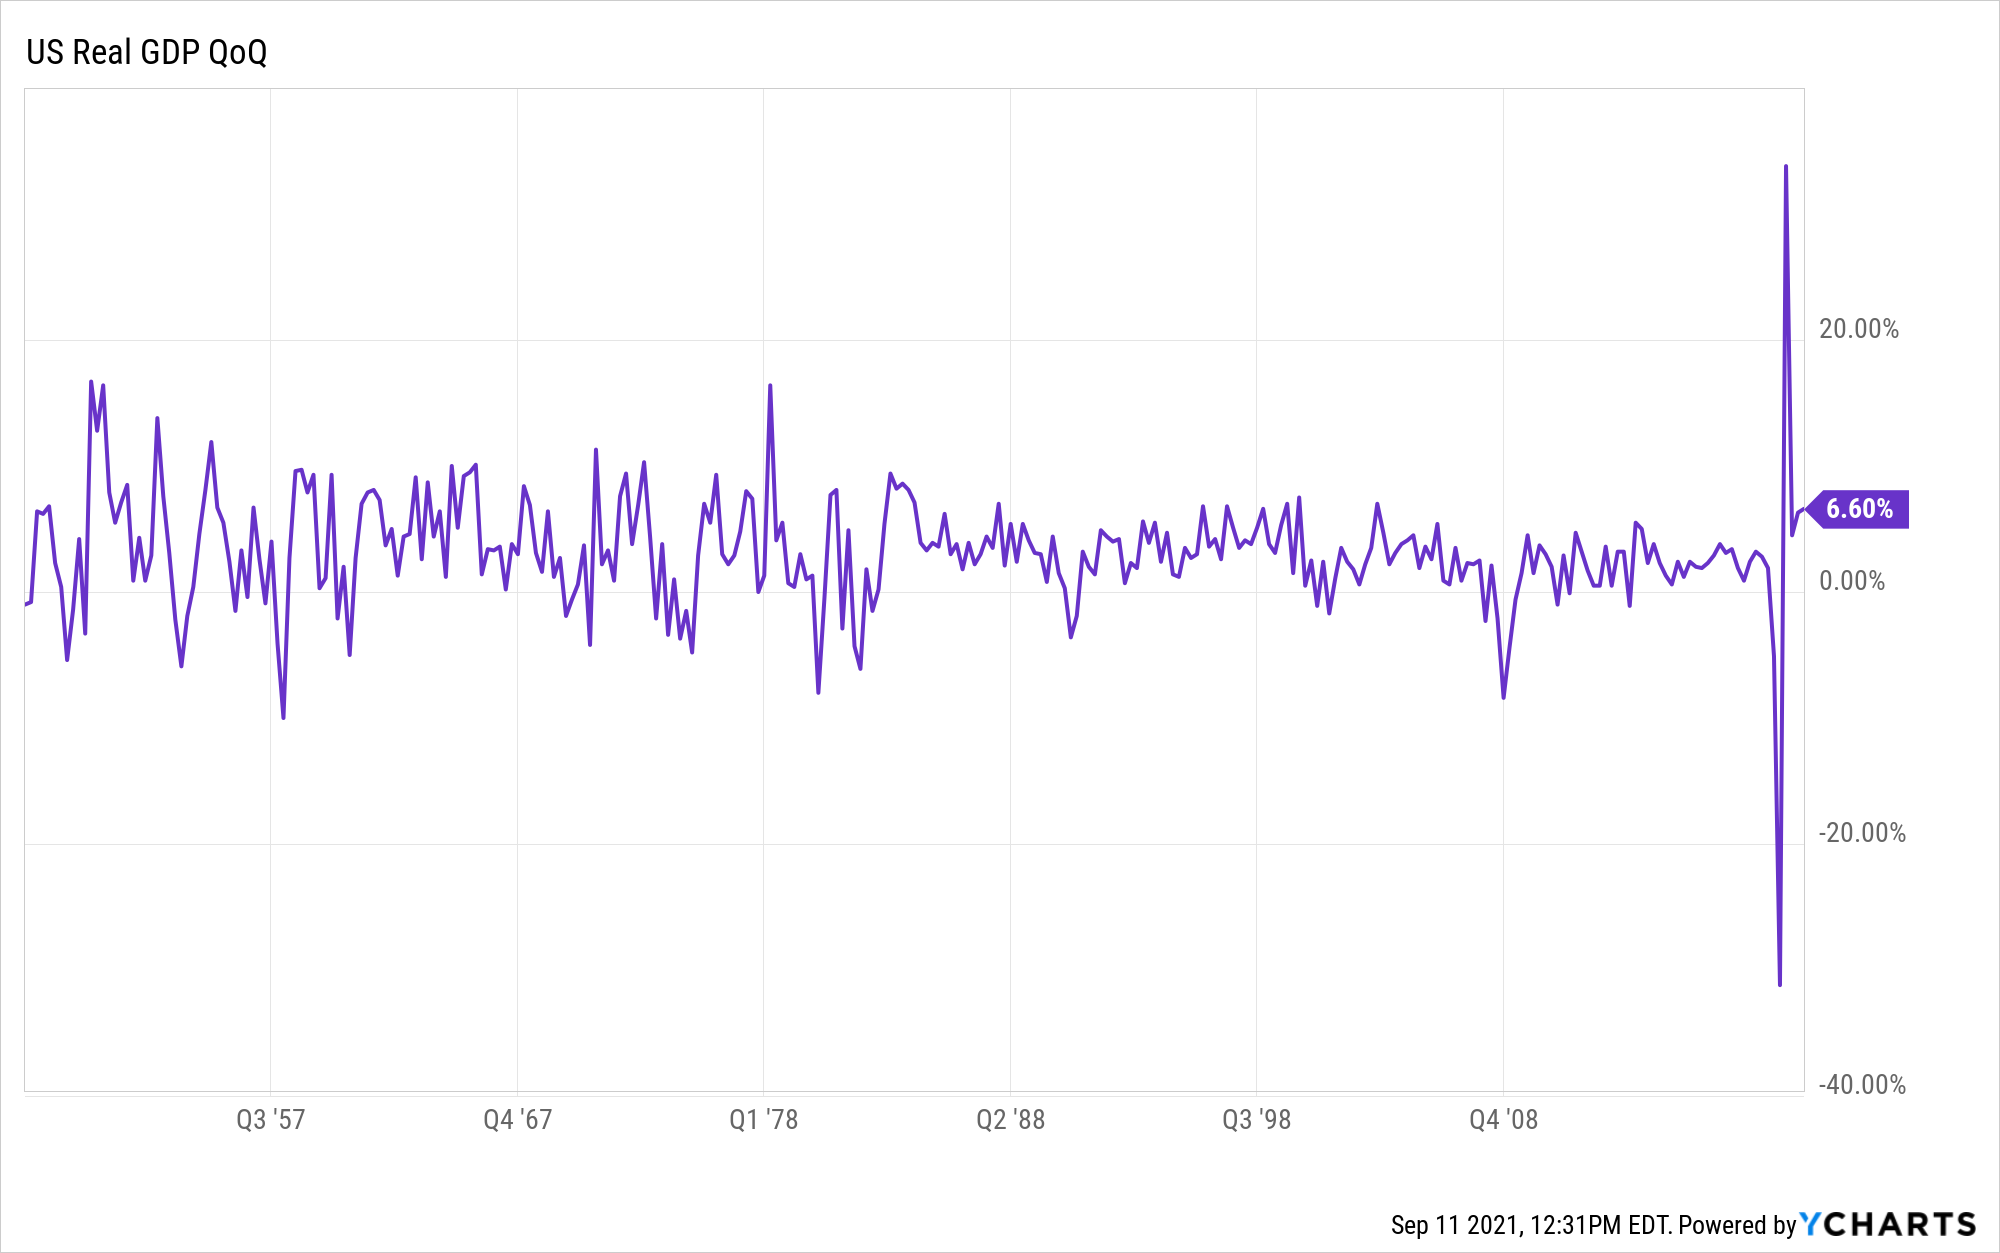
US Real GDP QoQ data by YCharts
But this temporary blip, caused obviously by the coronavirus pandemic, speaks to the wide range of possibilities under serious consideration for the path we could take over the course of the rest of this century. While over the last several decades economists, investors, and other observers have gotten used to the idea of the economy growing at a constant exponential rate of 2% a year or so, this seems to be an increasingly unpopular attitude. Seemingly every day we are seeing headlines about the devastating toll climate change will wreck on the global economy in the coming decades, stats that seem to be borne out by the disruption caused by increasingly frequent wildfires and hurricanes. We are also in the midst of a baby bust, as fertility rates around the world plummet to newfound lows, one of many trends that the pandemic seems to have accelerated. Population growth is rapidly decelerating worldwide (and is already negative in many nations) and there is reason to believe it will drag economic growth down with it.
On the other hand, there is also an increasing amount of attention being paid to the economic impact of rapidly advancing artificial intelligence. In a recent essay Sam Altman, cofounder of OpenAI, wrote:
In the next five years, computer programs that can think will read legal documents and give medical advice. In the next decade, they will do assembly-line work and maybe even become companions. And in the decades after that, they will do almost everything, including making new scientific discoveries that will expand our concept of “everything.”
A straightforward implication if this prediction is true is that economic growth will dramatically accelerate. (By the way if you’re not familiar with Sam Altman, OpenAI, and their natural language generator GPT-3, and find such a claim preposterous, I encourage you to read this op-ed article about AI written entirely by an AI.) And while as an insider selling a product Altman of course has an incentive to exaggerate the importance of his work, economists and other mainstream researchers are beginning to take more seriously the economics of machine intelligence. This summer the very smart folks at Open Philanthropy, a large philanthropic grant-making organization, released a detailed report, Could Advanced AI Drive Explosive Economic Growth? exploring this very question in the context of long-term economic history and mainstream economic growth models. I’ll dive into some of their findings below.
So what will economic growth be over the rest of the 21st century? The question is not a merely academic one. Readers of this blog and clients of ours come to us mostly to answer the question, “How soon can I retire and how much money can I live off of when I do?” In answering this, most financial advisors generally assume that the fundamental drivers of financial markets like corporate earnings and dividends will grow at a constant exponential rate in line with what economic growth has averaged over the last several decades. If this rate seriously slows down or speeds up it has significant consequences for how people should plan their financial lives today. More fundamentally, our understanding of the future is intimately tied to our subjective well being and how we live life on earth. While over the last two hundred years parents in the developed world have mostly gotten used to the idea that their children will have it better than they did, recent polls suggest that today majorities of people in rich countries think their children will be financial worse off than they are. The continued decline in fertility may have something to do with this. I know of some couples who decided not to have kids at least in part out of a concern for bringing them into a world ravaged by catastrophic climate change. Figuring out what direction economic growth will go is actually of very practical import to all of us, so let’s see if we can’t just solve that here.
To Infinity and Beyond
This isn’t the first time I’ve written on this topic. A couple years ago I wrote a post asking Is Economic Growth Speeding Up or Slowing Down? and concluded based on a careful parsing of the data that growth in global per capita incomes was continuing to accelerate. In that post I was mostly trying to reconcile the recently slow growth we’ve seen in the developed economies of the world vs the very fast growth we’ve witnessed in developing economies, and was not focused on what the fundamental long term drivers of economic growth are or how to model them mathematically. It turns out there’s actually a literature on this going back to the 1950s that I was only vaguely aware of at the time, and the Open Philanthropy report on AI mentioned above uses it as their workhorse model of history and possible future, and its implications are hilariously dramatic.
To start out with, here is our best estimate of total global economic output, world GDP (or GWP, Gross World Product), going back two thousand years:
The most important thing to note here is that the y-axis is on a log scale here, so an exponential trend would appear as a straight line. But GWP is not following a straight line on this chart, it looks like an exponential trend on an exponential scale – super exponential growth. Most economic historians have conceptualized this as history having a break point around the industrial revolution: growth was very slow before then, and much quicker after. But the data (and admittedly the data for these very distant points in history are highly uncertain) don’t seem to point towards some stark step-change but a relatively smooth curve. Is there an underlying mathematical structure that can describe this super exponential growth?
There is, in fact. Back in 1960 an Austrian-American scientist, Heinz von Foester, showed that human progress was well described by a model of hyperbolic growth. Economic growth theorists since have used the same basic equations and David Roodman and Tom Davidson at Open Philanthropy take it up in their model of how AI might lead to explosive growth. Here is Roodman’s hyperbolic growth (or power law) model fit back to 10,000 years of economic data.

The hyperbolic model fits the data much better than an exponential trend. But the exponential trend here looks very strange, bending down instead of upwards like we’re used to. On this graph, while the y-axis is on a familiar log scale, the x-axis is also on a log scale counting down (but not reaching) the year 2047. Why 2047? Because the way these hyperbolic growth models work is by modeling the growth rate as some number that is dividing by another number that gets smaller and smaller as time increases. In the formula that best fits the last 10,000 years of data, that denominator goes to zero in the year 2047 and the growth rate goes to infinity: a finite-time singularity.
Infinite economic growth within 26 years is a rather… bold prediction. But it’s a result that falls naturally out of the mathematics of recursive feedback loops. In the last thirty years “the singularity” has come to refer colloquially to the collection of historic events that will surround the creation of human-level artificial intelligence, and the term was coined intentionally in reference to this explosive feedback process. The basic thinking goes like this: a la Moore’s Law, computing power doubles every 2 years or so. Once machines reach human level intelligence though, they take over computer research and development. Two years later the next generation of AIs are twice as intelligent. They create the next generation in half the time. One year later the next generation is 4 times as intelligent as humans… Two years, one year, six months, three months… singularity. In the blink of an eye machines have achieved godlike superintelligence and within a few days disassemble the sun for extra disk space or maybe something even weirder. Whether AI destroys humanity or not in this process is an open question and one well outside the scope of this post.
Could something like this be what humanity has been marching inexorably towards for 10,000 years, led by the logic of a simple mathematical formula? Obviously nobody expects economic growth, or computational power, or anything measurable like that to actually go to infinity. In the most extreme limit fundamental physical constants like the speed of light and the Bekenstein bound put absolute limits on how fast a complex system or process can grow. But well before we break the laws of physics we might be talking about a world so radically different it might as well be infinite to mere mortals such as ourselves. If this “singularity ETA 2047” scenario roughly approximates how things will shake out it means that in the space of a few years we’ll go from “booming economy but mostly normal” to “unimaginably fast progress leading to scientific and technological breakthroughs practically every day” to “we’re harvesting all the free energy in the solar system and are now sending out probes at near-light-speed to colonize the galaxy.”
How not-actually-crazy is this crazy prospect? In the Open Philanthropy report Davidson concludes, “Ultimately, I find that explosive growth by 2100 is plausible but far from certain” and gives a “>10%” probability to such a scenario. Why not higher? Well, because of diminishing marginal returns, namely from slower population growth.
In the Open Philanthropy report, Davidson gives a thorough summary of the models used by economic growth theorists. I was surprised to learn that most of these models that are standard in the academic literature do not predict that growth should be a constant exponential rate, but either be sub-exponential or super exponential depending on certain conditions. Stable exponential growth generally only comes under certain “knife’s edge” conditions in which different factors perfectly counteract each other in a way we have no reason to suspect is how it actually works. These theories generally model the economy as the output of several inputs like labor, capital, and technology, and that these inputs are accumulable, they grow as a result of the output, causing feedback. Davidson explains:
Why do these models predict super exponential growth? The intuitive reason is that, with so many accumulable inputs, the feedback loop between the inputs and output is powerful enough that growth becomes faster and faster over time.
More precisely, the key is increasing returns to scale in accumulable inputs: when we double the level of every accumulable input, output more than doubles.
Why are there increasing returns to scale? The key is the insight, from Romer (1990), that technology is non-rival. If you use a new solar panel design in your factory, that doesn’t prevent me from using that same design in my factory; whereas if you use a particular machine/worker, that does prevent me from using that same machine/worker.
Imagine doubling the quantity of labor and capital, holding technology fixed. You could literally replicate every factory and worker inside it, and make everything you currently make a second time. Output would double. Crucially, you wouldn’t need to double the level of technology because ideas are non-rival: twice as many factories could use the same stock of ideas without them ‘running out’.
Now imagine also doubling the level of technology. We’d still have twice as many factories and twice as many workers, but now each factory would now be more productive. Output would more than double. This is increasing returns to scale: double the inputs, more than double the output.
This seems to be a reasonable description of the global economy up until the turn of the 20th century or so, as a bigger economy resulted in a larger population, but since then fertility rates have fallen and population growth is slowing dramatically. World population is projected by the UN to peak by the end of this century at just over 10 billion people and level off or even start falling from there.
With the key input of human population/labor slowing down, the prediction of these models is generally that economic growth will slow down as a result as well. This is the view today of many economists who are growth pessimists and is the conclusion Davidson comes to as well. The catch is that if AI becomes sufficiently advanced then it can begin to substitute perfectly for labor, which effectively raises population/labor super exponentially again, allowing the rest of the economy to grow super exponentially again as well. We’ll get to that, but first we have to disentangle the effects of our shifting demographics.
What Growth Slowdown?
It’s important to be clear what we’re saying here. So far we’ve been talking about total GWP, not per capita. But the claim is that a slowing population will slow down the latter as well. You’ll sometimes hear it claimed that while total GWP/GDP growth is bound to slow down due to falling population growth, per capita incomes can still keep growing because per capita income growth is determined by technological innovation, which is “exogenous”, it just sort of rains down on us like mana from heaven at a magical 1.5-2% rate each year. Not so, according to these endogenous growth models. Per capita income growth comes from technological innovation, and innovation comes from ideas, and ideas come from people. So if we stop growing people, we’ll eventually stop growing our incomes. Hyperbolic growth can be maintained as long as the outputs of the economy are used to create more inputs, including labor, but once the factors of production become sufficiently fixed growth will subside and turn sub-exponential. To support this theory, economists point to the slowdown in per-capita GDP of rich nations in recent decades that are already well advanced in the demographic transition, which we’ll get to in a second…
But a problem I’ve always had with these macro models is that they are quite abstract and course-grained. There are these homogenous inputs like labor and capital that are clearly delineated from each other but perfectly uniform with respect to themselves. Obviously the point of models is to simplify, but they should make things “simple as they need to be, and no simpler,” to paraphrase Einstein. And I think this framing allows us to miss some things. Labor, capital, and technology in fact are not so distinct from each other in many cases, and increasingly so. This is the point AI researchers try to make, that AI will be able to eventually substitute perfectly for labor. But the AI community has a tendency to fetishize the particular point of human-machine equivalence, literally the singularity. They imagine AI almost as from a scene in Frankenstein. The AI researcher flips a switch, the lights flicker, the AI powers up and says “beep beep boop I think therefore I am.” The researcher shouts, “My god! It’s sentient! It’s sentient!” Of course technology is never anything like that. Artificial intelligence for cars is already here and is mostly okay but isn’t doing any meaningful substitution of driving labor yet. Maybe in five years we’ll start to see autonomous taxis roll out in major cities, which will take a few years to catch on. Maybe in twenty years most cars on the road will be autonomous. The point is that AI, and computer systems generally, are already on the path of substituting and augmenting labor, and there won’t be any singular point where we cross over into a new paradigm.
More realistically, the economy is best thought of as the sum of manifold inputs and processes, all of which experience increasing or decreasing returns to scale over different lifecycles. We can model this mathematically as a sum of sigmoid functions (S-curves). Consider a simple S-curve, the canonical standard logistic function:

A sigmoid curve has the character of looking like an exponential curve in the first half of its plot, until it reaches the midpoint and slows down dramatically, slowly asymptoting towards its maximum value. In truth, the function is sub-exponential at every step along the way. That is, if you measure the rate of change at any two points, the point with the higher x-value will always have a lower rate. It’s just that the rate of deceleration is very slow at the start relative to the growth rate. S-curves “might as well be” exponential in their early points.
Notice that the growth of human population looks a lot like an S-curve. So does the history of airspeed records. So do a lot of technologies. Suppose we model the economy as the accumulation of multiple S-curve processes, representing human population growth or institutional quality or technologies of various kinds. Below I plot several separate sigmoid functions (in grey) with different growth rates and maximum values. In the blue I plot the sum of these functions.

The interesting thing about the blue line is that it oscillates between sub-exponential and super exponential growth depending on how its underlying constituents are waxing or waning. You can even make it look approximately hyperbolic if you line it up right, but constant exponential growth is generally not what you would expect. Hmmm this is starting to sound like the long run history of growth! The benefit of this model over the hyperbolic growth model is that it doesn’t predict any infinities (always a good thing for models trying to describe reality). Growth can continue indefinitely at any rate, even a super exponential one, without ever reaching a singularity, and there’s a natural way to model “saturation” where growth eventually does slow down: you just run out of s-curves that haven’t all already reached their asymptote.
The problem with this model is that you can use it to explain just about anything. You can fit it to just about any curve you want, and without a theory of what the underlying structure generating these S-curves is you can predict pretty much whatever you want, which is exactly what we’re about to do! (Sorry if you came here for definitive answers) But the takeaway is that we need not think of labor or human population as some essentially key ingredient to growth but rather one of many, and if population growth is scaling down its contribution might be offset by the scaling up of other processes such as AI. Maybe!
It’s also worth pointing out that in this perspective even the thing we are measuring might shift over time. Davidson and the growth theorists focus on total GWP, and for most of human history where more resources meant more humans this was appropriate. But since the industrial revolution more resources has mostly meant richer humans instead. GWP per capita might be the more relevant measure these days. This is awkward because the industrial revolution really was a sea change for per capita income. Before then nearly everybody lived at roughly subsistence level (something in the neighborhood of $800/year in today’s dollars), after then living standards have risen super exponentially. It’s conceivable that through the 21st century we will see sub-exponential growth of total GWP but super exponential growth of per-capita GWP, depending on how the underlying processes shake out. This is problematic for folks who like to describe the entire history of the human project with straight lines, but sometimes the world is just messy.
Okay, but what does the evidence so far actually say about the relation between slowing population growth and per-capita income growth? Well, if you look at rich countries on the technological frontier you see that their population growth has been slowing down for decades now (if it’s not already negative) and so has their per-capita GDP growth. Below I plot the 20-year average (real, PPP-adjusted) GDP-per-capita growth rate for six countries: The USA, Denmark, France, Great Britain, Italy, and the Netherlands. I focus on these six because we have estimates for per-capita income for them for every year going back to 1820, they were all among the richest nations in the world at that time, and they remain among the richest nations in the world today, so they’re all good candidates for frontier growth countries.

Source: Maddison Project Database
Taking the long view, it’s clear that each of these countries has slowed down from their postwar boom decades, but the recent decline looks more like a return to normalcy like we saw in the first century of the data rather than a great stagnation. Maybe growth has actually been basically constant over this entire period and WWII was just a really big shock that we’re all finally mostly settled down from?
If we do the same exercise for the population growth of these countries, and compare the average population growth over time with the average income growth, there doesn’t seem to be any significant correlation between the two series, including if we try with lagged population growth numbers (based on the assumption that it takes a while for a freshly hatched human to become useful for the economy).
So, yes economic growth has slowed down in rich countries in recent decades, although it’s not clear that this is outside the normal range and we should expect it to continue declining to (or past) zero, and it’s far from obvious that lower fertility is to blame. Now let’s turn our attention to long-term income growth for the world, per-capita GWP. Below I plot the 20-year average growth rate for per-capita GWP. (Constructing this series took a lot of annoying data wrangling, so check my notes** at the bottom for details if you like to nit-pick, but my conclusions should be reasonably robust to different specifications.)

In the early days of the industrial revolution, income growth was very modest, less than half a percent per year. Over the last twenty years incomes around the world have grown at more than five times that rate, 2.5%. I plot, along with the actual data, the best-fit line. Yes, that is an exponential curve. This is exponential growth of the rate of exponential growth. Not hyperbolic growth, mind you, it won’t take you to infinity, but it’ll get you where you need to go. If we trace it backward it asymptotes to zero somewhere around the start of the Renaissance, which comports with our intuitive understanding of history and the limited spotty data we have. If we extrapolate it forward it predicts GWP per-capita growing at nearly 5% by 2100, a rate at which peoples’ incomes double nearly every decade. If you look at the most recent data we appear to be right on the nose of the trend. I don’t know guys but it doesn’t look like growth is slowing down to me.
This was the conclusion I reached in my last post about growth. There, I was trying to reconcile the difference between slow growth in economically advanced countries and fast growth in emerging economies. The usual story you hear about this is that growth has slowed down in the rich world, probably for demographic reasons, perhaps permanently, but the high-paced growth in developing countries right now is just “catch-up growth” and unrelated to growth at the frontier. Once they catch up with their first-world peers, these countries will slow down too. I put forward an alternative, more optimistic hypothesis that in my view better fits the data and explains the differential in terms of globalization and capital exporting. Rich country growth has been slow and poor country growth has been fast because rich countries have been financing the development of poor countries, allocating their capital less to their domestic markets and more to emerging markets where lower capital/labor ratios means higher potential returns. This process will continue until development across nations is roughly equilibrated, at which point growth will even out more at a higher rate.
In addition to being supported by standard textbook theories of development economics, I point to four lines of evidence in favor of this globalization-based view of differential growth rates:
- Coincidence of timing: The slowdown in the developed world just so happens to coincide (at least in the broad scope of history) with the speedup in the developing world. This would be an unusual coincidence if catch-up growth was unrelated to a demographic-based slowdown, but makes perfect sense in the capital-exporting model.
- Coincidence of magnitude: Similarly, the amount that developing economies have sped up just so happens to almost perfectly offset the degree to which advanced economies have slowed such that global growth has stayed right on track to trend. This would be a weird coincidence if they’re unrelated but makes sense if they’re part of the same process.
- Declining labor share of income: If advanced economy growth has slowed down because labor has become more of a bottleneck, then we would most likely expect to see the labor share of national income rise in these markets. Instead we have seen the opposite as labor has fallen relative to capital income in the US and other rich countries.
- Distribution of per-capita wealth growth: If international income growth disparities are driven by capital flows from rich nations to poor ones we might expect per-capita wealth in rich nations to do a better job of keeping up with the rest of the world as first world investors and capitalists tap into faster growing markets through their financial assets. This is indeed what we see. According to Credit Suisse’s Global Wealth Report, between 2000 and 2020 the six rich countries mentioned above grew their per-capita wealth at a median annualized rate of 4.8%, exactly the same as the rest of the world.
In the standard story, as emerging economies approach the technological frontier they will slow down, dragging down per-capita GWP growth with it. In my telling of the story, as emerging economies approach the technological frontier rich countries will revert to growing fast again, and global growth will continue to gradually accelerate. Which story is correct? Only time will tell. But we’ve now laid the groundwork we need to make a plausible bear case and bull case for the global economy in the 21st century. Let’s start with the glass-half-empty take.
The Bear Case
The case for economic pessimism this century is taking endogenous growth theory and the facts of falling fertility and decelerating growth at the technological frontier all very seriously. Population growth is going to slow to a crawl this century, there’s good theoretical reasons to believe this will translate into lower productivity growth, which we’re already witnessing across the developed world. Even if the empirical evidence linking these two isn’t rock-solid, in broad brush strokes they seem to be moving in the same direction and that is what theory predicts. Technological innovation is in decline and artificial intelligence isn’t going to save us anytime soon. There’s no evidence that information technology is meaningfully accelerating productivity growth, and those claiming that in ten years robots will be able to do anything a human can are just spouting the same hype they have been for decades. Oh, and climate change. That’s gonna be a real downer. Let’s get that out of the way now.
The thing with these headlines about the cost of climate change is that, as usual, the media often makes the most wildly sensationalist claim possible that is technically true without providing useful context. That New York Times headline about climate change costing $23 trillion by 2050 is from a report by the re-insurer Swiss Re (an organization with a strong financial incentive to accurately assess the risks of climate change). $23 trillion seems like an impossibly large number and like we must be headed for economic Armageddon. But as is generally the case with these reports, that’s not saying the economy will be $23 trillion poorer than it is today, that’s $23 trillion less than in 2050 than it counterfactually would be without any climate change. In this and most other scenarios being seriously considered the world is still richer by the end of the century than it is today, even in worst-case scenarios, and of course that $23 trillion figure is Swiss Re’s estimate of the worst case scenario. The (sort of) good news about climate change is that truly apocalyptic, runaway feedback scenarios have mostly been ruled out by scientists at this point. Even if we do nothing, we will not be facing the extinction of the human race or a Mad Max style collapse scenario. Climate change will be bad, $23 trillion is a lot of money to let go to waste, but “I’m not having kids because economic growth will be a bit lower than it was in the past” doesn’t have quite the same ring to it as “I’m not having kids because I don’t want them to inherit an unlivable hellscape.”
With that faint bit of optimism out of the way, let me walk it back a bit. The thing about these estimates of how much of the economy will be lost versus the counterfactual without climate change is that they have to make an assumption about what economic growth will be in the meantime. And generally these assumptions take the standard story that the economy will grow at a more or less constant 1.5%-2% per-capita rate. What if growth comes in significantly lower than that?
Let’s model future world growth as an extrapolation of the trend of recent rich world growth. Below I take the six rich countries from above and add in Australia, Canada, Germany, Japan, Sweden, and Switzerland as a sample of a dozen major industrialized nations on the technological frontier. I plot the median 20-year average annualized per-capita GDP growth going back to 1980 along with the trendline. This leaves the immediate postwar boom out of the figures and should give us insight on the trend in frontier growth over recent decades.

Average income growth has fallen roughly by half over the last few decades in leading advanced countries. The best fit line for the data is a function of exponential decay, which if we project out to 2100 predicts that growth will be barely above half a percent. If we take this trend seriously as the consequence of “coming off the s-curve” of population growth and research productivity, and furthermore believe that developing world growth is “just catch-up growth” and will likely peter out soon, then we might take this extrapolation as a reasonable approximation of what global growth will look like for the rest of the century. And now lets add in the damage from climate change.
One of the most highly cited papers on the pessimistic end of the economics-of-climate-change literature is Burke, et al (2015), Global Non-linear Effect of Temperature on Economic Production, which estimates that “unmitigated warming is expected to reshape the global economy by reducing average global incomes roughly 23% by 2100 and widening global income inequality, relative to scenarios without climate change.” (There are other serious papers that estimate the damage much more conservatively at 2%-10%, so there is clearly uncertainty among experts on the topic; I am intentionally using the most pessimistic plausible assumptions to make the bear case). If we apply that 23% income loss scenario against a counterfactual baseline of constant 1.5% growth, measure the absolute dollar magnitude of that loss, then project that same haircut onto a scenario of exponentially decaying growth, we find the below projections of trend growth up to 2100.
 If we stack relatively pessimistic assumptions about climate change damage on top of relatively pessimistic assumptions about the drivers of economic growth then we end up in a world where growth continually deteriorates throughout the 21st century, eventually turning persistently negative by the later decades. Now, even in this very pessimistic scenario average growth over the next 80 years is still positive, and the median person in 2100 is still nearly twice as rich as the median person is today. But these relatively prosaic aggregate statistics will mask a lot of inequality. Climate change may actually economically benefit colder countries (which tend to be richer) while severely harming equatorial regions (which tend to be poorer). Large parts of south Asia and Oceania may become virtually uninhabitable if climate change continues unabated and countries in those regions may see their economies dramatically decline in absolute terms. According to Burke, et al, in the worst case scenario 43% of countries will be poorer in 2100 than they are today, although I personally find the economic assumptions in this scenario to be unrealistically pessimistic (in their high growth scenario 5% of countries are poorer in 2100 in absolute terms).
This bear case basically describes humanity as “levelling off” in the 21st century. For the last few centuries the population of our species and the average standard of living has increased generation over generation. By the end of the century both those measures will plateau and the human race will go back to the condition it faced in the millennia before the industrial revolution, one where growth is too slow to be noticeable and living standards do not appreciably change over time. People will still be much richer and generally better off than they were centuries ago, so it’s still a nice world in many ways, just not a very exciting one. Climate change will present many challenges, to put it mildly, but even if we end up running behind schedule it’s hard to imagine renewable energy technologies not supplanting fossil fuels by the latter half of the century at the latest (I’m forecasting much sooner). Damage from accumulated emissions will drag on the global economy for decades, but eventually those will subside and humankind will enter a great era of stagnant affluence.
The Bull Case
The case for economic optimism this century is taking the centuries or even millennia-long trend in growth seriously and extrapolating it out. Even if we are coming off the S-curve of population growth and sliding down the negative S-curve of climate change, other sigmoidal growth modes are coming online which will offset these trends and keep growth exponential or super exponential for the rest of the century, just as has been the case all through history. Even though population growth has slowed to a crawl or is in decline in countries on the technological frontier, limiting the person-hours that can be thrown at productivity-enhancing innovations, we are still climbing the S-curve of globalization, lifting people out of poverty and subsistence lifestyles and providing them education and training. This means that the effective number of people able to contribute meaningfully to global growth is still growing rapidly. This trend should continue for at least a couple more decades, at which point it seems plausible to assume that automation from artificial intelligence will have started to contribute meaningfully to economic growth. This will take us to the point where the number of autonomous or semi-autonomous agents in the economy continues to rise at an accelerating pace, regardless of what human population growth is doing.
If we extrapolate the exponential-growth-of-exponential-growth trend we saw above for GWP per-capita since the industrial revolution into the rest of the century we get this:
 In this possible future globalization and technological innovation maintain an accelerating pace of economic growth, and climate change has minimal negative impact (probably because clean energy technologies are rapidly adopted over the next two decades), resulting in income growth that keeps marching upwards until it clocks in near 5% by 2100, about double where it is now. To most non-economists, the difference between 2.5% vs 5% income growth might not sound that meaningful. But it really, really is. Since the start of the 21st century only a small handful of developing nations have achieved income growth greater than 5%, including China, India, and Bangladesh. In these faster-growing countries people are generally much more optimistic about the economic future than their counterparts in the slower-growing rich world. Whereas in the US and other rich countries people can make plausible arguments either way about whether the millennials are better off than the baby boomers, in fast-growing developing countries the answer is patently obvious, today’s young people are much better off than their parents and grandparents. And in a world growing at 5% across the board this fact will become obvious to everyone. And we’ll all be fantastically richer to boot. If we extrapolate US per-capita GDP along this growth path we predict that the average American will have an income of about $922,000 in 2100, nearly 20x what it is today (in reality we’d expect the US to grow a bit slower than the rest of the world but still, we’d expect a more-than-10x multiple of today’s incomes).
The secret to happiness is a high standard of living combined with the belief that things will keep getting even better, especially for one’s children/descendants. In the bull case for economic growth, the future will have both in spades.
The Future: I’ll Meet you There
How plausible are these possible futures? In the bear case stagnation story I laid out average growth over the next 80 years is about half a percent. In the bull case acceleration story it’s about 3.5%. It just so happens that these numbers correspond almost exactly with the upper and lower bound estimates from this National Academy of Sciences survey of experts on long-run economic growth (the median estimate, unsurprisingly, was about 2%). This was completely unintentional on my part, and I have no idea if the experts surveyed were conceptualizing the scenarios of acceleration vs deceleration that I’ve depicted here, but it’s nice to have some independent confirmation.
As dramatic as the consequences of these differing predictions are though, it will take quite a bit of time before we can determine which path we’re actually on. To get a sense of the confidence interval on these forecasts, I ran a Monte Carlo simulation of the growth of US per-capita GDP under the four scenarios of decelerating growth (Stagnation), constant growth (Baseline), accelerating growth (Acceleration), and hyperbolic growth (Singularity), using a 3% standard deviation for the annual growth rate to proxy normal cyclical fluctuations. Below I plot the median, 10th percentile, and 90th percentile paths for each of these scenarios.

If the singularity is near and we’re on the path of hyperbolic growth we’ll know it by about the end of the decade. It’ll look like Sam Altman describes, very suddenly robots can do basically everything. Short of that, the confidence intervals for the Stagnation, Baseline, and Acceleration paths don’t fully diverge until the 2050s or 60s. So with the safety of 30+ years before I can be proved wrong let me offer my best guess as to what the future will hold. I think there is some small (~5%) chance that something approximating the singularity will actually happen, that the creation of human-equivalent AI will represent something of a step-change in history that dramatically accelerates growth beyond our wildest imaginations. I also think there’s at least a 5% chance that we face some sort of existential catastrophe this century, most likely a nuclear war but also potentially a runaway unfriendly AI scenario (there’s little point in plotting this, it could look like any of the above trendlines until a random year when the line goes to zero overnight). But I put most of my weight on “fluctuating super exponential and sub-exponential growth bounded between the Acceleration and Baseline scenarios.” We are in the midst of several Great Transitions here in the early days of the 21st century: globalization, demographic slowdown, climate change, and artificial intelligence. Which factors will win out over any given time will wax and wane in the coming decades and contribute to the normal economic booms and busts we’ve always seen. But my strong intuition is that life and complex systems will always tend towards accelerating growth until they saturate the energy supply of their systems. This has been the tendency of the human race since our beginning and arguably of all complex life that came before us, and I wouldn’t bet against it now. The human race now consumes in one year about one millionth of the energy that our sun produces every single second, so we’ve still got a lot of room to grow well beyond the horizon of what might be a very fast-paced 21st century.
** Notes on data. Data on historical global and country-level GDP come from the Maddison Project Database. In order to construct series of per-capita GWP I aggregated country-level statistics to a global composite. This presents challenges because there are year-by-year estimates for some countries back to the early 19th century, but not others. Many countries start their series at later dates and/or have missing data in between first and last points. To handle missing data in between estimated points I used simple linear interpolation. To estimate country GWP back to 1820 for countries with no data back that far I extrapolated the earliest datapoint backwards using the average growth rate for all countries with data, back to a minimum per-capita figure of $800, a ballpark estimate of subsistence income. For population growth I apply a similar procedure but do not have a minimum lower bound estimate for backfilled country-level population. Checking these aggregated figures against Maddison’s composite measures available at selected dates confirms broad consistency, and using somewhat different methods should not significantly change the trends we see over time.


