
You’ve probably heard it, maybe you’re worried about it: stocks are expensive, bonds are expensive, real estate is expensive, it seems like just about everywhere you look markets are overvalued. Are we in the mother of all bubbles? In my last post, I tried to assuage some of these concerns and point to some corners of the market that actually looked downright attractive. Just because market valuations are high right now doesn’t mean the financial apocalypse is coming, and if you look beyond conventional asset classes there are still some investments out there that look undervalued.
Today, I’m going to take the opposite tack and look at the investments that seem to be the most overvalued right now. These are the ugliest assets out there in a world that’s looking less pretty by the day. These are the investments that look unreasonably rich, perhaps even bubbly, and which long-term investors interested in fundamentals would do well to avoid, or at least significantly underweight in their portfolios.
In my last post, I looked across the global capital markets for value and explored a diverse set of assets: emerging market stocks and bonds, equity put-write strategies, and preferred stocks. These overvalued investments, on the other hand, all have a lot more in common with one another: they’re all happening right in my back yard. Welcome to the new San Francisco gold rush.
Bay Area Technology Companies
Over a hundred years ago, San Francisco resident Mark Twain is supposed to have said “History doesn’t repeat itself, but it often rhymes.” [note]Like many aphorisms attributed to Twain, this quotation appears to be apocryphal.[/note] Twenty years ago, the San Francisco Bay Area was the epicenter of the (in)famous dot-com bubble, an episode in which investors hurled money at internet companies, no questions asked. Between 1997 and 2002 the tech-heavy Nasdaq Composite index rose more than 275% and then erased all its gains just as quickly as the internet bubble burst.
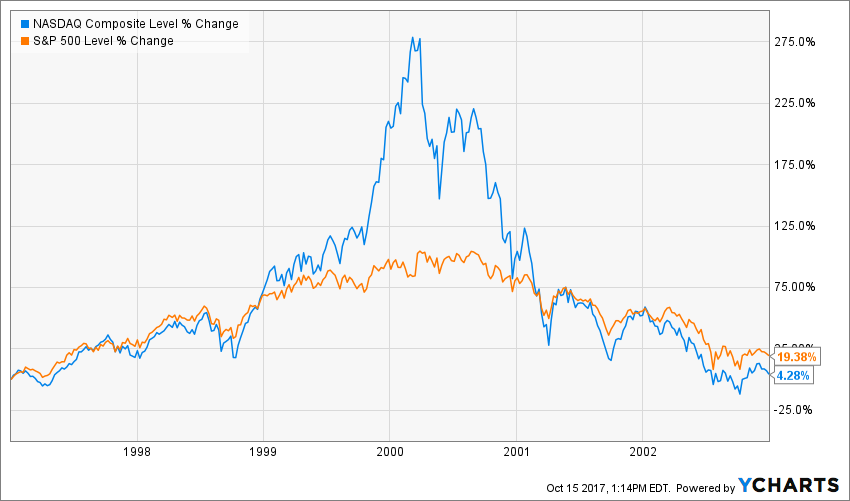
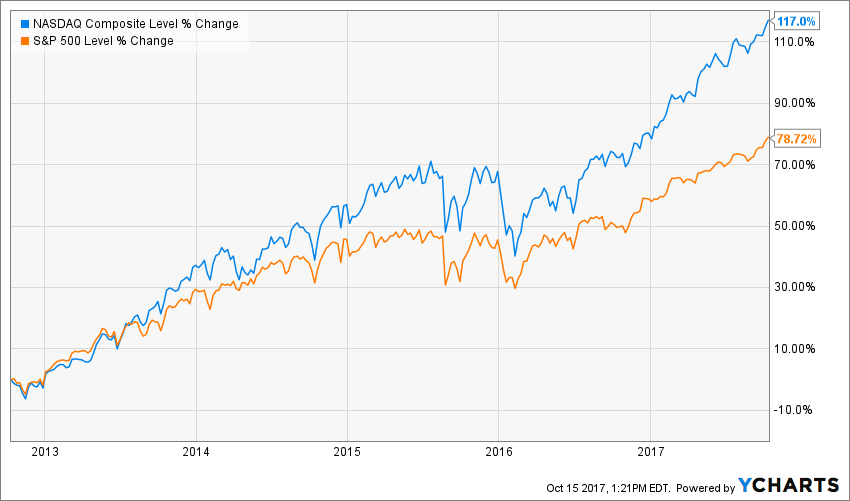
Fast forward to the present, and once again the technology sector is outpacing the broader market.
Many of the names have changed, but the story is much the same: new transformative technologies are going to disrupt old ways of doing business. Don’t invest in the old economy because software eats everything. Yeah yeah yeah. It’s a story that’s as old as investing itself and I know how it ends. It goes like this: innovation allows new firms to gain market share and grow at abnormally high rates for a while. Investors notice the growth and reward the innovative firms by flocking to invest, bidding up the stock prices in anticipation of continued excellence. But it is inherently difficult to remain innovative and continuously grow quicker than the rest; much of innovation is serendipitous and hard to repeat, competitors are quick to copy and adapt, and elevated profits place a giant target on your back for the next wave of entrepreneurs, not to mention lawsuits and antitrust investigations. Almost inevitably, those firms that investors are most optimistic about fail to live up to the lofty expectations the market imposes on them and their returns suffer as a result. Meanwhile, those companies that have gone unloved or overlooked generally keep just chugging along, beating expectations and the market rate of return.
This, of course, is the story of value investing, something we talk about a lot here. In the long run, just about everywhere we look, stocks that are cheap relative to their fundamentals have outperformed stocks that are expensive relative to their fundamentals. Since 1951, for example, the stocks with the lowest decile price-to-earnings (P/E) ratio have outperformed the stocks with the highest decile P/E ratio by over 6% annually in the US.

Source: Ken French Data Library.
Now, can you guess which are the highest priced stocks in today’s market? To find out, I downloaded information on the current largest 1,000 stocks in the US. Because we can build a more robust measure of a company’s valuation by looking at multiple signals, I compare across four different common valuation metrics: Price-to-Book (P/B), Price-to-Earnings (P/E), Price-to-Sales (P/S), and Enterprise-Value-to-Earnings-Before-Interest-Taxes-Depreciation-and-Amortization (EV/EBITDA). I rank each stock on each metric and then take an average to create a composite valuation ranking. Sorting from top to bottom we indeed find that everybody’s favorite tech companies by the Bay are right at the top of the list, including Netflix (#17), Tesla (#54), Facebook (#70) and Amazon.com (#80) (I know Amazon is based in Seattle, just play along). Also in the top decile you’ll find names like Autodesk, NVIDIA, Red Hat, Palo Alto Networks, Adobe Systems, Salesforce, Square, PayPal, and of course, my favorite, Snap, a company whose IPO I singled out earlier this year for being a shameless cash-grab by the founders (SNAP is down more than 30% since I wrote that post, just sayin’). In fact, out of 137 firms in the top 1,000 with headquarters in California, 42 of them are in the most expensive decile of the market, nearly all of which are Bay Area information or bio-technology companies. (Some of the more established tech giants such as Apple, Microsoft (Seattle again), and even Google to a lesser extent look more reasonably valued.)
But wait, it gets worse! Not only are these Bay Area tech companies extremely expensive, many of them are engaged in practices destructive to shareholder value. For example, one fundamental metric that’s complementary to value investing is the asset growth effect, and it works in the opposite way you might suspect: firms that have experienced the highest growth in their assets deliver substantially worse returns than firms with low (or negative) asset growth. While intuitively you might expect that a growing asset base would mean strong and improving company fundamentals, the purpose of a corporation is not to become large, the purpose of a corporation is to deliver value to its shareholders. The primary way of doing that is to return cash to shareholders through dividends or share repurchaces, not generally through buying more stuff, especially when that stuff is sub-profitable. But corporate managers often have an “empire bias,” greatly overestimating the benefits of new expansions or acquisitions which more often benefit only their own compensation rather than the company’s bottom-line. At the extreme end what you see are executives engaging in legal expropriation of the shareholders as they buy themselves corporate jets and lavish facilities.
Which companies are growing their assets the fastest in today’s markets? You guessed it. Tesla, Square, Netflix, Amazon.com and Facebook are all in the top decile. Salesforce, though only #158 on the list, I think deserves the award for most conspicuous display of asset growth, as the new Salesforce Tower (pictured above) grows each new day to dominate the San Francisco skyline. By the way did you know that new skyscrapers are a good way to spot bubbles?
To top it off, there are many other ancillary signs of bubbly behavior. Critics of the dot-com bubble decried the fact that these internet companies weren’t making any money. While many of today’s tech giants are extremely profitable, many still aren’t. Tesla, Salesforce, Square, Autodesk and many others are losing money. Amazon.com is only barely profitable after over 20 years in business, and just greatly expanded its assets to buy a grocery store, a notoriously low-margin business. Several of these firms have been actively diluting their shareholders by issuing more equity, including Netflix, Tesla, Square, and Snap.
The last days of the dot-com bubble saw an explosion of speculation as investors pushed the most expensive decile of stocks up past a P/E of 70. Right now Amazon’s is 255 and Netflix’s is 240. In the last days of the bubble the most expensive companies’ balance sheets swelled up at a rate of 20%. Right now Facebook and Amazon are north of 30%, Netflix is at 42%, and Tesla is at 119%. Bay Area: Buyer Beware.
Bay Area Real Estate
According to stock market lore, investor Joe Kennedy (father of John F.) sold out of the stock market days before the great crash of 1929 after a shoeshine boy offered him unsolicited stock tips. Figuring the market must be over-bought if even shoeshine boys are buying, Joe cashed in and saved his fortune from the collapse.
I was reminded of this anecdote the other day as I was getting my hair cut. Just as I was collecting my thoughts on what I would write for this post, my barber informed me that he had recently purchased two new houses in Oakland, each for more than a million dollars, and that he expected them to double in value within the next three years. It was not clear to me if he meant he thought his equity would double because he had so much leverage on these investment properties or if he thought the assessed value of each house would literally increase 100%, and I’m not sure which interpretation is more terrifying.
It’s no secret that housing prices in the Bay Area have gone up quite a bit since the end of the bust in 2009. In fact, the average San Francisco residence has roughly doubled since then, greatly outpacing the rest of the country.

And it’s not like they were all that cheap to begin with. The average home in San Francisco is now worth $864,000 as of August 2017 (1,039,000 in San Jose), according to zillow.com, making Bay Area housing the most expensive in the country by a wide margin (Los Angeles is in third at $612,000).
I think it’s important to put this all in historical context. Major housing price appreciations like this are not normal. Research by the economist Robert Shiller looking at housing prices across the US going back to the 19th century shows that home prices generally rise at about the rate of inflation and little more.

Source: Robert Shiller’s Online Data
This chart plots an index of housing prices across the US adjusted for inflation. The total annualized real return on a hypothetical average American home over this 128-year period was 0.4%, less than the rate on short-term government bonds (with a lot more risk). Of this meager return, most of it came in the last 20 years. Now, compare this chart to the one above it: Bay Area home prices have gone up more in the last 8 years than the entire rest of the country has in the last 128.
Many people are surprised to see that houses have gone up so little over the long-run, but from an economist’s perspective it’s not surprising at all, because for most people, a house is not an investment asset; it’s a consumer good, just like a car or a refrigerator or a fidget spinner, none of which we expect to get more valuable as we use it. The only reason houses hold their value at all is that they (and the land they sit on) remain useful for so long, and of course only then with considerable upkeep over the years.
Nonetheless, we can apply similar valuation methods from other investment assets to the housing market to get a sense of where are the over vs. under-priced places to live. Just as we talk about the nominal yield on a bond or the earnings yield on stocks, the appropriate yield for the housing market is the rental yield, the average yield homeowners can earn by renting out their homes divided by the value of the house. If rental yields are relatively low (i.e. prices are high), developers will rush to try to bring additional housing to the market while landlords will be incentivized to cash out and leave the market in favor of higher-yielding locations or asset classes. The same dynamic plays out in reverse for high-yield/low-price real estate markets. What has been the relation between rental yields and subsequent price developments across real estate markets in the US? In the following chart I plot two housing investment strategies similar to the one based on stock P/E ratios above. The “High Yield” portfolio invests in the five US metropolitan regions (out of the 50 largest) with the highest rental yield, rebalanced annually. The “Low Yield” portfolio invests in the five lowest yielding regions.

Source: zillow.com. Analysis by RHS Financial
As expected, regions with higher rental yields experience greater subsequent price appreciation than lower yielding regions. While the total difference in long-run returns between the two over this period isn’t very substantial [note]If we account for rental income, the difference is substantial, amounting to several percentage points per year depending on how we account for reinvestment and ignoring the (many) costs associated with being a landlord.[/note], the difference in risk is. The low yield regions experienced a massive runup during the housing bubble and a major subsequent bust, losing more than 32% between 2006 and 2012, more than enough to put those who bought with 20% down near the peak under water. For the high-yield regions, on the other hand, the housing bubble was relatively minor blip, associated with an 8.8% decline over a smaller number of years.
Of course, the low-yield areas have bounced back with vengeance since the bottom of the housing bust, so where are we at now? The rental yield across the United States has averaged 8.9% since 1979. Right now it’s at 8.5%, not much lower. In San Jose, however, the region with the lowest yield among the top 50 metro areas, the rental yield is now only 4.1% as of June 2017. San Francisco is second lowest at 4.7%. In other words, investors can easily earn a higher yield on their money by simply buying a high-yield bond or preferred stock ETF rather than being a Bay Area landlord, arguably with a lot less risk (especially considering how concentrated a bet real estate is for most investors), and definitely with a lot fewer headaches. These yields are only slightly higher than they were at the peak of the housing bubble in 2006 when Bay Area rentals yields got down to the mid-3% range. I would not bet on them getting down that low again, much less staying there very long.
Now of course most people are not going to buy or sell their house because of short term fluctuations in the rental yield. But if you’re already on the margin these are facts you may want to consider. If you currently own real estate in the Bay and have been thinking about moving anyway, now might be a good time. If you currently rent in the Bay and have been thinking about buying, maybe wait a little longer. If you’re looking into buying a Bay Area real estate investment property, you may want to reconsider. And on behalf of all the renters here, if you’re currently one of the brave souls trying to develop property here, please hurry up.
Bitcoin (and other cryptocurrencies)
Okay, so I was going to finish off this post discussing the Bitcoin bubble. Bitcoin, the favorite investment fad of Bay Area tech geeks and weirdos (I say that lovingly, considering myself both), recently surpassed a USD price of $6,000, putting the total supply in circulation worth about $100 billion. But then I got to writing about all the many things wrong with this insane market and three thousand words later I figured it best to spin-off that post onto its own and save it for next week. Until then, I leave you with this image, copied from a sidebar ad I encountered during my research, as airtight evidence that this is a market at the top of its peak:

Need I say more?
So stay tuned, next week I take on Bitcoin, assuming it still exists…
\
This cannot be construed as a solicitation or recommendation to purchase a security(ies) as RHS Financial and its opinions are subject to change given varying market conditions and the relative time horizons and risk parameters of its clients. The strategies and performance is based upon what we believe to be reliable and correct sources but cannot be guaranteed.
RHS Financial, LLC is not responsible for errors or omissions in the material on third party websites, and does not necessarily approve of or endorse the information provided. Users who gain access to third party websites may be subject to the copyright and other restrictions on use imposed by those providers and assume responsibility and risk from use of those websites.

