
The US economy is down, but the US stock market is up, and now valuations are at about the all-time highs we last saw in the dot-com bubble. In my post last week we looked at this in detail and went over why stock prices in the long run have to track real economic fundamentals, like earnings or GDP. Whenever stock prices get ahead of fundamentals they have a tendency to come back down to earth, and this appears to be the situation we find ourselves in now as the stock market continues to defy the gravity of the 2020 recession.
But not all stocks are up. In fact, most aren’t. Of the top 3,000 stocks in the US, only about a third have had positive returns in 2020 as of the end of July, and the median return is -13.1%. The slightly positive year-to-date return on the S&P 500 masks a tremendous amount of variation within the market. The rally has been dominated by large growth stocks, particularly in information technology sectors; most everything else has been left behind. I expressed this with the following chart last time; the tech-heavy NASDAQ index is up more than 25%, while small-cap and value stock indexes are down double-digit percentages.

So today we’re going to zoom in on the tech giant darlings of today’s market and see where they are with respect to economic reality.
The NASDAQ Strikes Back
Last time we looked at the growth of stock prices relative to GDP both in the US and around the world and found that the two are tightly coupled in the long run. The ratio of stock prices to GDP tends not to grow in the long run, and whenever it gets very high returns are likely to subsequently fall. We then saw that the stock price to GDP ratio is currently at an all-time high for the S&P 500. What’s it like for the NASDAQ?
Crazy bananas. That’s what.
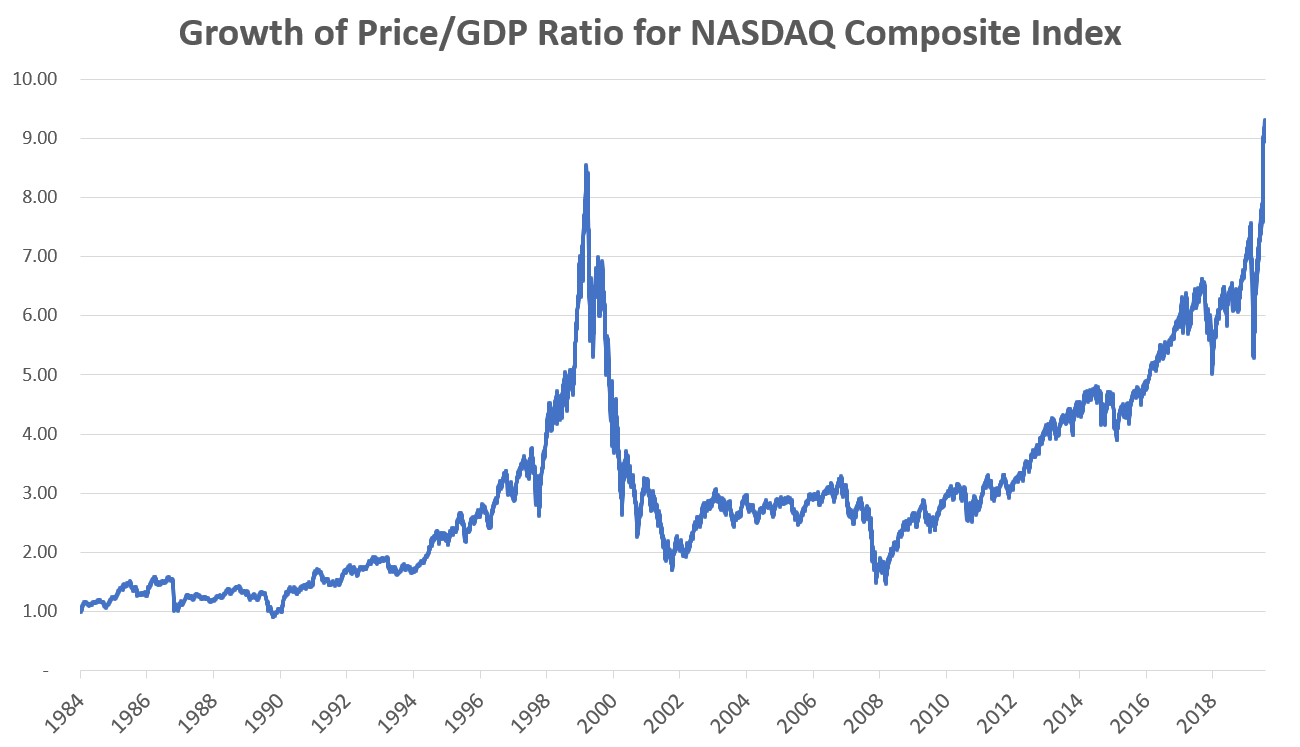 The valuation of the NASDAQ relative to national economic output has now surpassed the peak it last experienced in the dot-com bubble of the late ’90s. Now, this is a similar result as what we saw for the S&P 500, but the dot-com bubble serves as a much more extreme benchmark for the NASDAQ as it does for the S&P 500. While the price-to-GDP ratio about tripled for the S&P 500 between 1990 and early 2000, for the NASDAQ it increased nearly nine-fold. Again, in the long run this series shouldn’t experience any growth at all! This doesn’t necessarily mean it’s destined to fall back to one (I start the series in 1984, which happens to be close to a multi-decade low for US stock valuations, so we’re starting at a low point), but the many-fold increases we saw in the 1990s and again in the 2010s are definitely not normal.
How’d things work out last time? The NASDAQ got closest to its current valuation in March 2000. Between then and its bottom in October 2002 it lost just over 75% of its value (the S&P 500 lost “only” about 45%). It wasn’t until 2016 that the NASDAQ’s price level fully recovered from the dot-com bust. Investing at extreme valuations can be extremely dangerous for your wealth.
Today’s tech investors may object: The dot-com bubble was a totally different situation! Many of those companies back then didn’t even have a business plan, much less any profits. The top companies in the NASDAQ today are extremely profitable and globally dominant in their industries. The valuations are justified.
Okay, let’s look at those earnings. In the following graph I plot the growth of prices versus earnings for the top ten stocks in the NASDAQ compared with the top ten US value stocks (defined as having bottom quintile price-to-earnings ratio) as of the end of July 2020. These stocks are Adobe, Alphabet, Amazon.com, Apple, Facebook, Intel, Microsoft, NVIDIA, Netflix, and Tesla for the NASDAQ. For the value stocks, they are Anthem Inc, Bank of America, CVS, Cigna, Citigroup, Intel (the only duplicate), IBM, JPMorgan, Morgan Stanley, and Verizon. Starting at the beginning of 2014, which is about as long as growth/tech stocks have been outperforming value stocks, I plot the growth of the aggregate sum of trailing-twelve-month net income and market capitalization for these two groups. Remember, in the long run prices and earnings must go up by roughly the same amount.
 Today’s top tech companies have indeed had strong earnings growth in recent years, averaging 14.3% per year since 2014. But their market values have rocketed far in advance of that, up an annualized 26% over the same period. (note this is the growth in market capitalization, not the total return, which would be higher. Using market cap excludes the effects of dividends and share repurchases.) The value companies had much more modest performance, growing their net income at an annualized 6.4% rate, which is incidentally right in line with global GDP growth over the period. (By the way, in recent decades it’s arguably true that global GDP is a more relevant comparison for the largest multinational corporations in the market than domestic GDP is. For our purposes here this doesn’t make a big difference to our results, though.) The value companies’ market caps, however, have not kept up with their fundamentals, growing only at a 3.0% rate.
So the NASDAQ companies have had extremely strong earnings growth, but even still their stock prices have massively overshot that. We saw a brief moment of convergence in late 2018, but since then their prices have soared even higher still. Meanwhile value companies have had fundamentals in line with historical norms but their prices have lagged behind. We know that in the long run these series must converge, so the tech stocks would seem overvalued. What’s more, we know that, strong as their earnings growth has been recently, it’s completely unsustainable. You cannot grow your earnings at triple the rate of economic growth forever. If today’s prices are based on assuming they will, tech investors may be in for a rude awakening.
But Colby, my hypothetical tech investor interlocutor may object, nobody really expects these companies to grow at these rates until the end of time. But if they just keep it up for the next several years then their prices are justified. Given that they’ve already managed to keep it up for several years and technology keeps becoming an ever more integral part of our lives, this seems like a perfectly reasonable assumption.
This brings me to a result that I find that people have the hardest time believing from the finance research literature: if a company has recently had above average earnings growth, that does not predict that they will continue to have above average earnings growth; in fact, if anything, it’s the opposite. This is a result I pointed out last post about the market in aggregate: aggregate market earnings growth in one year has zero relation with earnings growth the next year, and longer term earnings growth actually negatively predicts future earnings growth. It’s much the same for individual companies: if a particular company has had above-average growth recently, that’s no indication whatsoever that it will continue to do so. If anything, it’s evidence that it will actually have below-average growth in the future.
One of the seminal articles on this research was Chan, Karceski, and Lakonishok’s (CLK) 2001 paper, The Level and Persistence of Growth Rates. Their abstract succinctly makes the case for how futile forecasting earnings growth can be:
There is scant persistence in growth beyond chance, and limited ability to identify firms with high future long-term growth. [Analyst estimates of earnings] are too optimistic, and have low predictive power for long-term growth. Regressions using a variety of predictors confirm the low predictability in growth. Valuations that assume persistently high growth over prolonged periods rest on shaky foundations.
In my experience, people hate this idea. It just seems so obviously wrong. Am I really suggesting that whether Macy’s or Amazon.com grows faster is a coin flip? Don’t we all know who’s going to win that race? This intuition seems to rest on people confusing the growth of earnings per share with a fuzzier notion like market share or brand recognition, an example of “answering an easier question” under the the affect heuristic, a common cognitive bias studied by behavioral psychologists. In fact, sales growth is more persistent and predictable, but that does not necessarily translate into earnings growth, which is what is ultimately more relevant to investors. CLK point this out in their paper:
The persistence in sales growth may reflect shifts in customer demand, which are probably fairly longlasting. A firm can also sustain momentum in sales by expanding into new markets and opening new stores, by rolling out new or improved products, or by granting increasingly favorable credit terms. Persistence in sales may also arise from managers’ “empire-building” efforts, such as expanding market share regardless of profitability. In all these cases, however, costs are also likely to rise at the same time, so profits may not show as much persistence as sales. It may be relatively easy for a firm to generate growth in sales (by selling at a steep discount, for example), but this is a far cry from generating growth in profits.
CLK’s main methodology in their paper is to look at growth streaks: what percentage of firms have had above-median growth over the last x years, and how many is that compared to what we would just expect by random chance? Consider in a given year all the firms that have had above-median growth that year, by definition that will be half of them. Now ask, if earnings growth is random, what percent of these firms will have above-median growth next year as well? Again, 50 percent. If growth is persistent, it will be above 50%. The following year that number will drop to 25% if chance is the only factor. The year after that, 12.5%. And so on. CLK collect growth data on US firms from 1951 – 1998 and this is what they find:
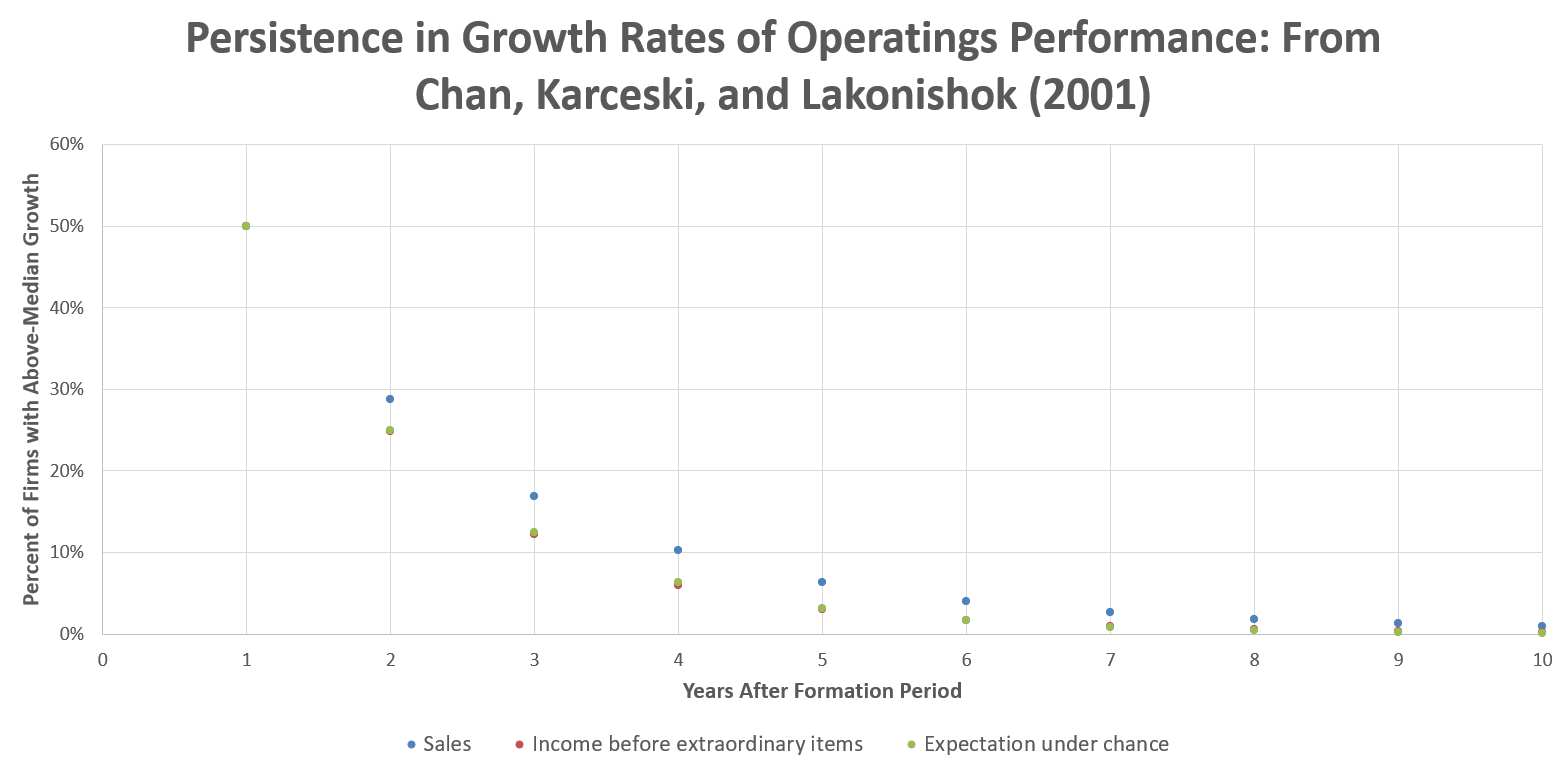 The green points represent what we would expect to see if growth rates were purely random. The blue points for sales growth as we can see is generally slightly above the green points, indicating that sales growth does have modest persistence; companies with high recent sales growth are more likely to continue experiencing high sales growth. The red dots represent income before extraordinary items, CLK’s measure of the “bottom line” here. If you have a hard time making them out it’s because they’re all basically hiding under the green points, that is, they almost perfectly follow what we would expect from pure chance. CLK conduct a battery of additional tests, looking at different sub-samples of the market and trying different predictor variables. They conclude that that earnings growth exhibits almost no predictability, and in fact if we look at growth over the last five years, it slightly negatively predicts future earnings.
This should sound an alarm for today’s tech investors. The incredible 14.3% earnings growth the top NASDAQ stocks have enjoyed in recent years is no evidence they will continue to do even slightly above average. If anything, we might expect them to do slightly below average. CLK were writing at the height of the last tech bubble and their warning about the “shaky foundations” on which high valuations rest turned out to be prophetic. Still, today’s tech investors may hold out hope that today’s economy is different somehow. Perhaps changes in technology and the macro-economy have made earnings more persistent in recent years? It certainly does seem like those top NASDAQ stocks have had a remarkably consistent run.
To test this, I decided to look at growth rates for US companies in the recent years that large growth stocks have outperformed their value stock counterparts. Of the top 3,000 stocks in the US right now, I downloaded earnings-per-share data and compared the growth between 2013, 2016, and 2019, asking “could we predict the last few years of EPS growth using the previous few years worth of EPS growth?” The chart below plots the log EPS growth rate for each company from 2013 – 2016 against its log EPS growth rate from 2016 – 2019 (there were 1,821 companies in the sample with valid data).
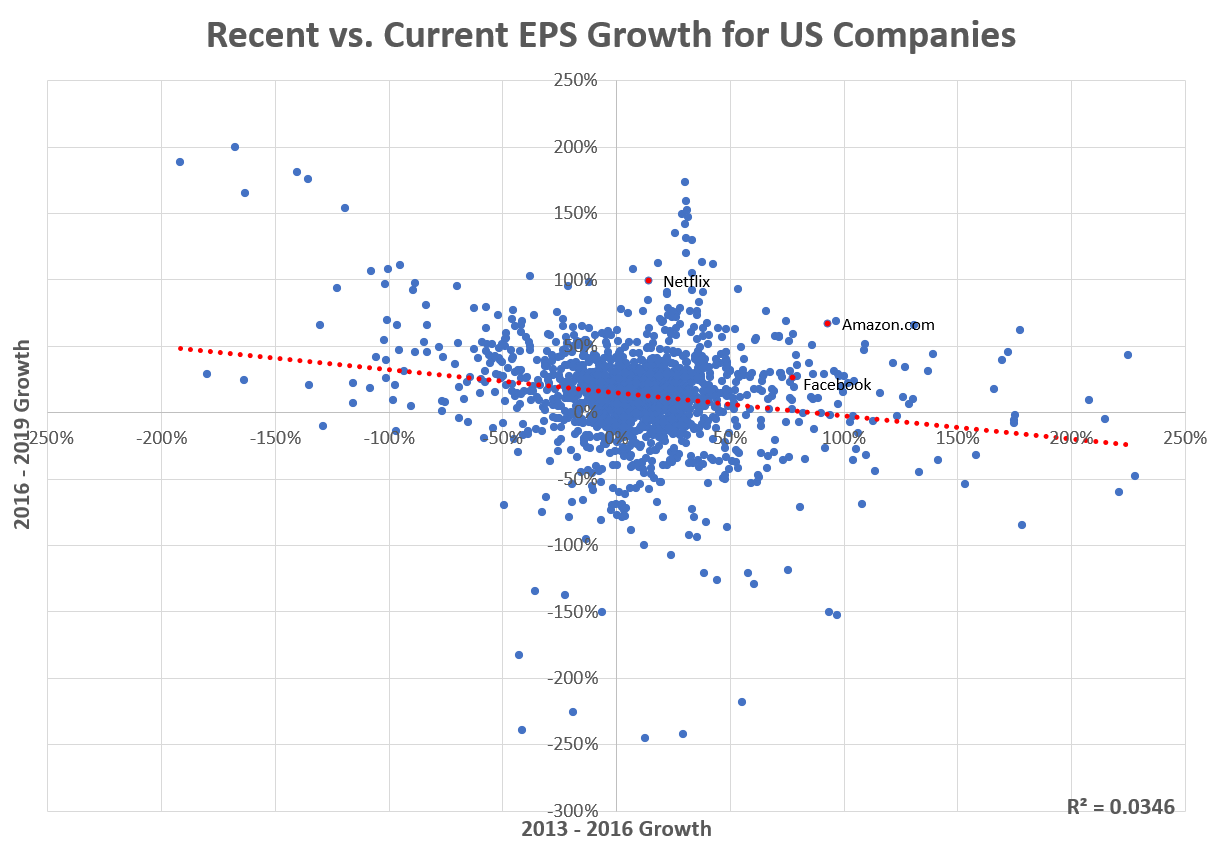 Nope! Consistent with CLK and other research, if in 2016 you looked at a stock and saw it had had high EPS growth the last three years, that gave you no indication that it would have high EPS growth in the next three years. In fact, slightly the opposite. As you can see, the trendline has a negative slope, indicating past out-performance predicts future under-performance. I use log growth rates here, because there are a number of extreme outliers. If we throw out the most extreme few dozen outliers from each period (which are typically driven by one-off events like a major write-down or sale of a subsidiary) the predictive relation pretty much goes away entirely. Within the normal range of outcomes, past success does not predict future success in earnings.
You can also see I highlighted a few familiar names from our top NASDAQ stocks list. Amazon.com, Facebook, Netflix, among some of the other top names in tech, are examples of companies that had abnormally high earnings growth in both sample periods. We expect that by random chance that over any given several-year window there will be a small handful of firms that post consistently high growth, and it so happens that in the recent window since 2013 or so these have disproportionately been large tech firms. You can always tell stories about why these stocks are the anointed ones and their growth will continue unabated for years on end, but history tells us this is usually a losing bet and soon regress to average in the face of increasing costs, competitive pressures, and for some of the biggest of the bunch, perhaps even antitrust litigation.
Growth stocks are expensive because they are expected to grow faster than average, but most of the time these expectations are dashed by the reality that most things are merely average. As prices overshoot fundamentals this gap between expectations and reality widens. How wide is it right now? Let’s pick on Amazon for a minute. Right now Amazon.com has a price-to-earnings ratio of about 120 (!) with no dividend yield. It’s net income of $11.59 billion last year represents a growth rate of about 26%/year for the last ten years. We know that it can’t keep growing at 26%/year forever, and it’s already a gargantuan operation, so it’s going to have to level off at some point. Suppose we assume it will grow at an elevated rate for the next ten years, after which point it will grow at the same rate as the economy and have a normal-ish price/earnings ratio of 20. Let’s assume that all the while Amazon’s stock price increases at 9%/year, consistent with long-term stock returns (of course, most Amazon shareholder probably think it will go up more than that, but we’ll see even this is extremely optimistic). How quickly will Amazon have to grow its earnings over the next ten years for this scenario to work out? Plugging in the numbers we arrive at a figure of 30.4% growth every year, a more than 14-fold increase over the course of a decade.
How plausible is it that Amazon, already one of the largest companies in the history of the world, can continue to grow its bottom line by roughly 5 times the rate of economic growth every year for the next decade? I mean, never say never, but that would fall somewhere in the category of “absolutely unprecedented event probably never seen before in world financial history.” According to CLK, the top 2 percent of firms in history have had 10 year earnings growth of 23.8%. This last decade has had higher-than-average growth rates, and by my count about 6% of firms with ten year data have had earnings growth above 30%. Of these, all of them were much smaller ten years ago, with earnings of just millions or tens of millions of dollars. Achieving 30%/year earnings growth over a decade will turn a medium-sized company into one of the world’s giants. If you are already one of the world’s giants, it will… well there just aren’t any examples of it happening.
Amazon achieving 30% growth over the next decade is a pipe dream. Much more likely they will grow roughly in line with global GDP, if that. Let’s say 6%/year. Assuming that’s true, and they arrive at the same normal-ish P/E ratio of 20 at the end of ten years, how much would the price grow in order to achieve that scenario? Plugging in the numbers, the answer is it wouldn’t. It would have to shrink. By 11.4% per year. For a decade. That would take the price down from its current ~$3,150 to $939 by 2030. When expectations from companies differ so dramatically from what can realistically be achieved the most likely outcome will be disappointment.
Value is Down but not Out
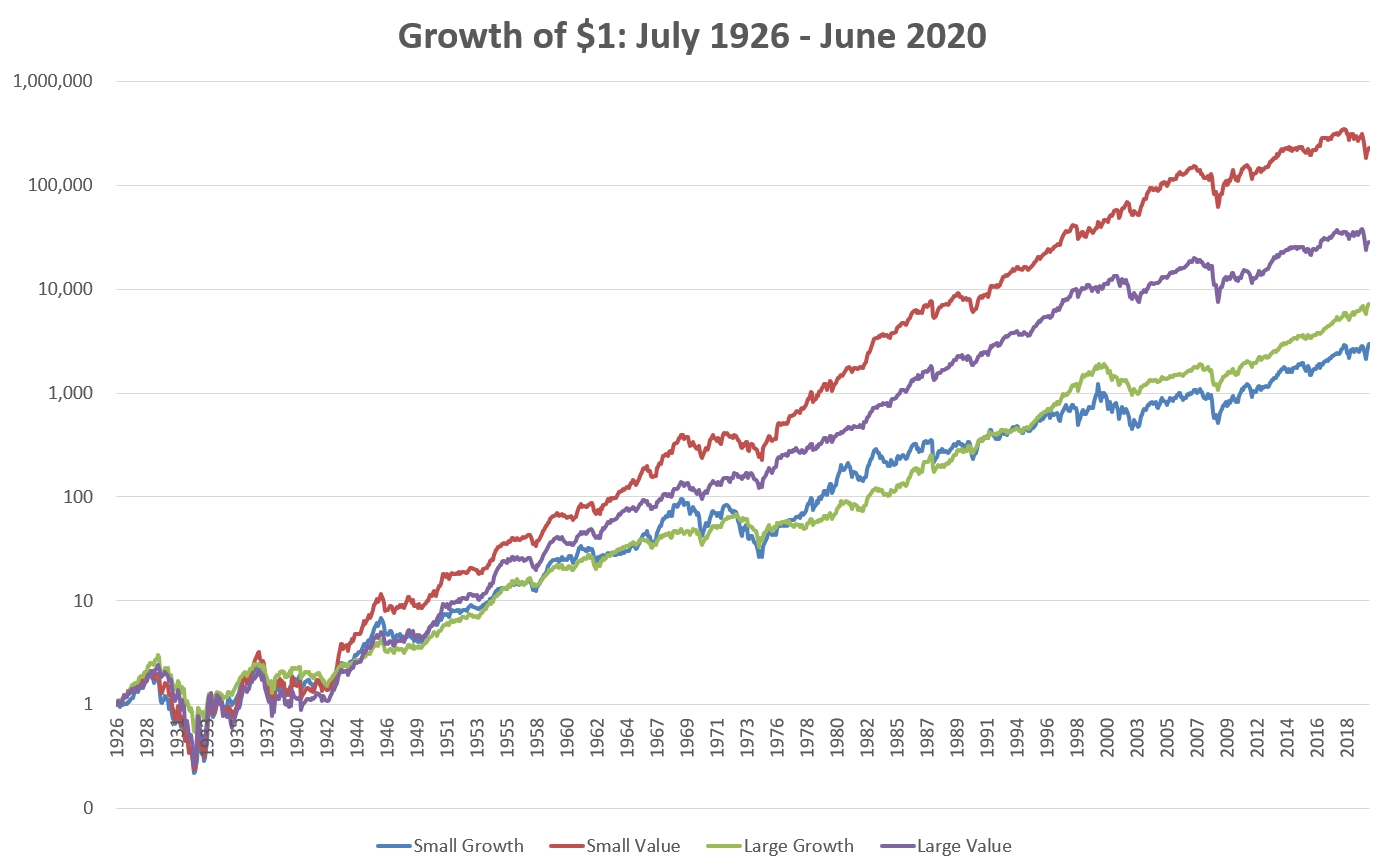
In the long run, value stocks have historically beaten growth stocks. This has largely been because growth stocks fail to deliver. People continually expect earnings growth to persist and are perennially surprised when prices revert back to fundamentals instead of the other way around. Using price-to-book as our valuation metric and looking at the four corners of the equity style box, this has been the results of investing in value versus growth stocks in large and small companies in the US since 1926, using the standard conventions of the Ken French database.
 But outperformance over the long run does not mean outperformance each and every year. Over the last several years the fortunes have reversed and growth stocks, especially the large growth tech stocks, have trounced their value counterparts.
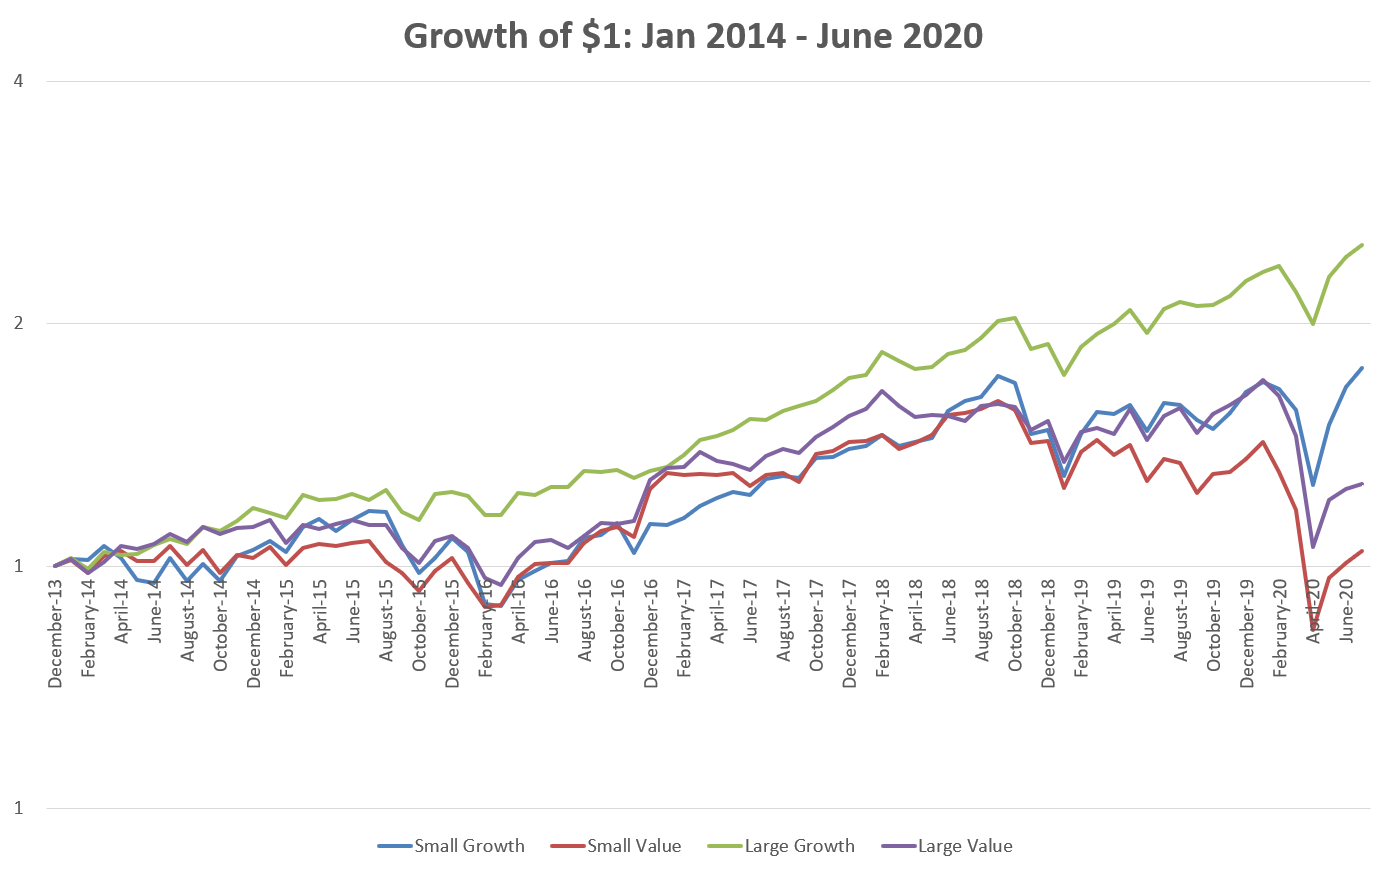 As we have seen, this has been because large growth companies have – probably by historical fluke – actually had much higher than average earnings growth over this period, on top of the fact that valuations have swelled at an even faster rate. But we know such growth is unlikely to persist for long, and now valuations are near all time highs. Meanwhile, value stocks have posted roughly average growth in their fundamentals, but have seen their valuations shrink in relation to them. And so the gap between value and growth stocks is around all-time highs. Below is the evolution of the price/book ratio of the four style box groupings over time.
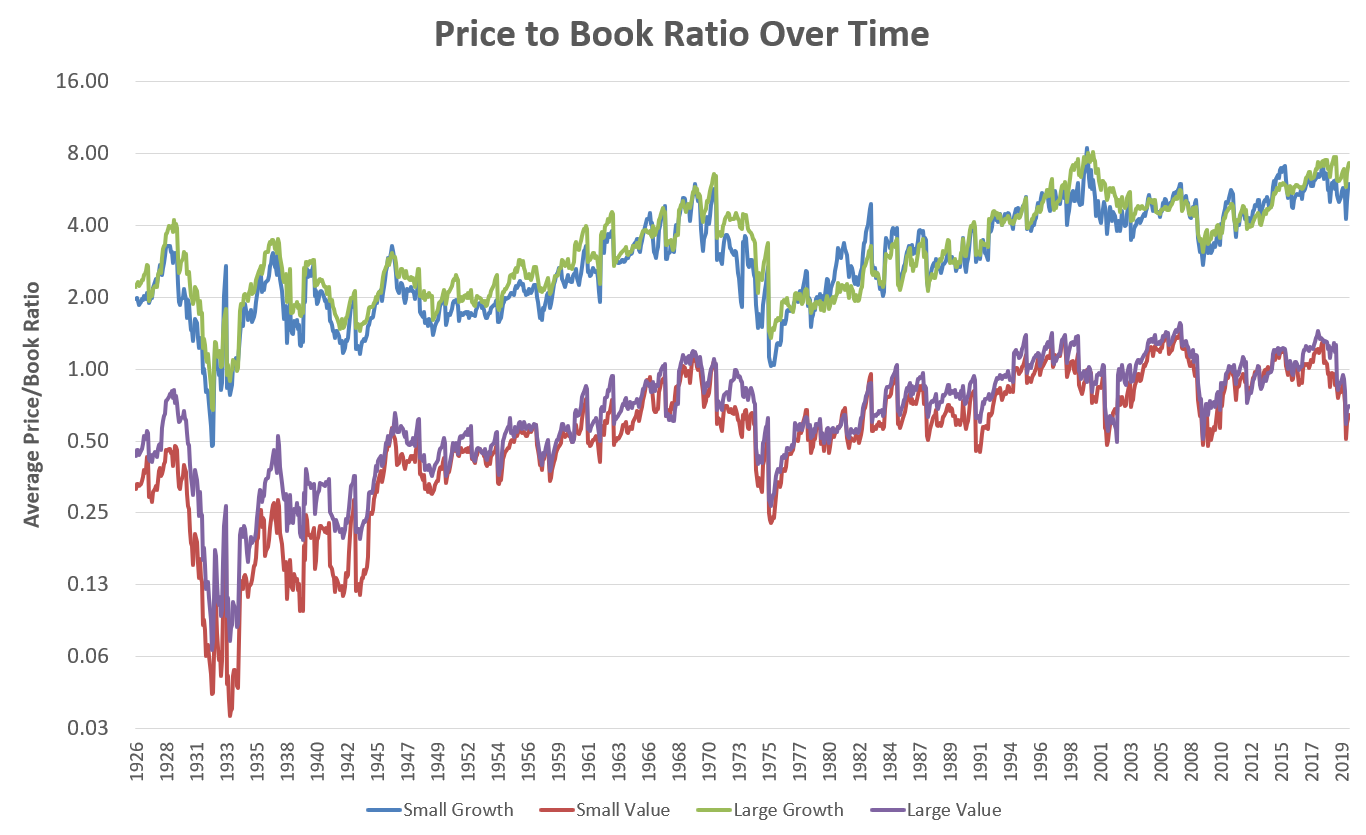 Large growth and small growth companies are in the 98th and 96th percentile respectively of their valuation history as of the end of June, basically just about where they were at their dot-com highs. Large Value and small value companies, on the other hand, are only in their 53rd and 58th percentile of history respectively. So about average, and actually they haven’t been much lower than they are right now since the 1970s.
And like we’ve done before with the market in aggregate, we can run regressions and see how well starting valuations have predicted future returns for each of these market segments. I do that for each of the four segments below, comparing price/book ratio with the subsequent year’s return. I also draw a vertical line to plot where the current valuation stands as of June.
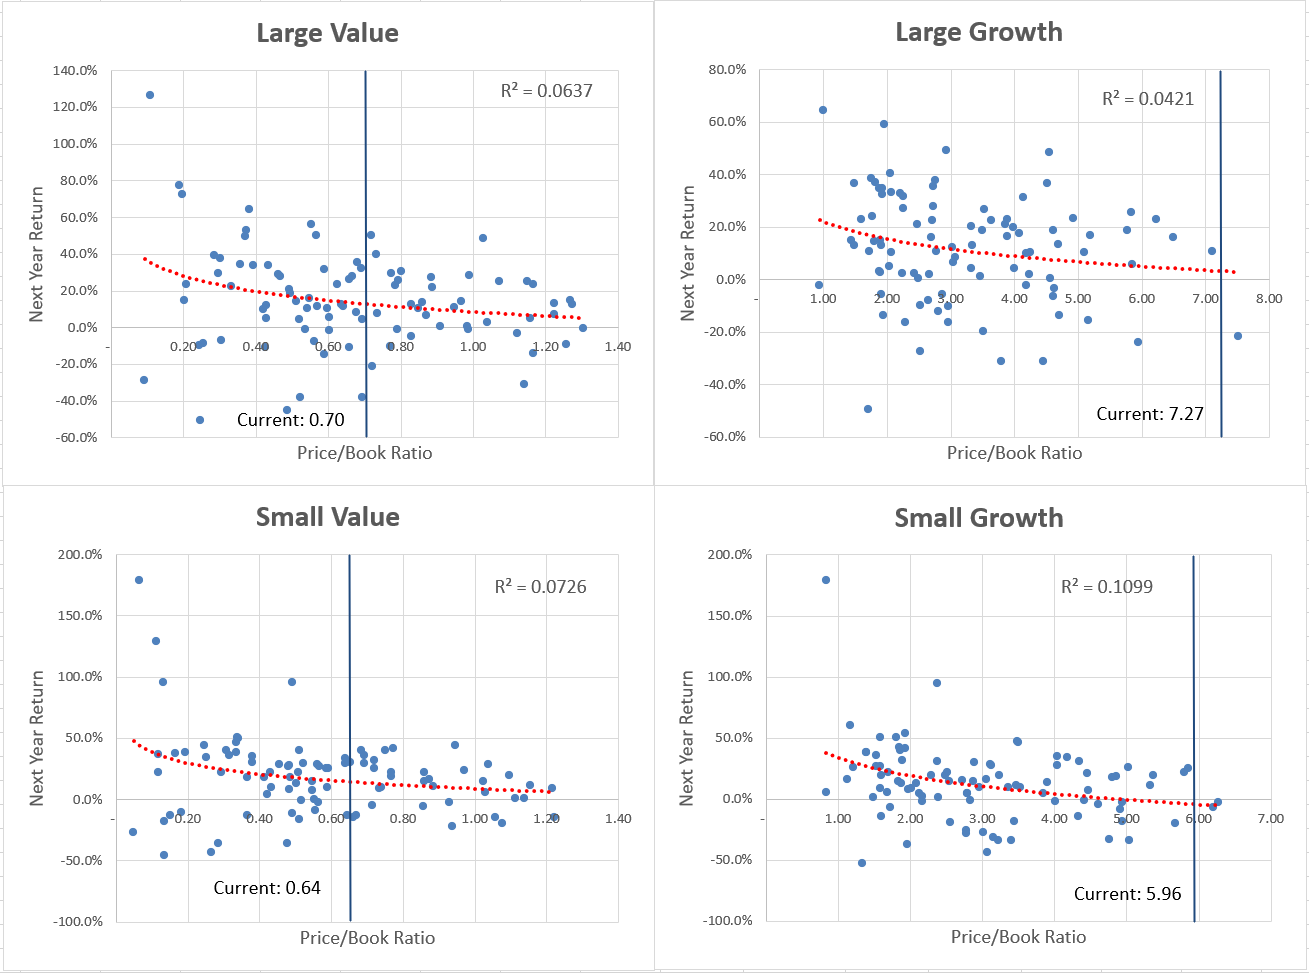 The growth side of the market, with its valuations close to their peaks, forecasts near-zero returns over the next year, but double-digit returns for value stocks. And at the top of the heap the disparities are even more extreme. Some of the largest tech stocks have valuations that are many multiples of the large growth aggregate shown above, including Tesla, Amazon, Netflix, and Paypal, each with P/E ratios around 100 or greater. As always, statistical forecasts such as these are a very noisy source of information and should not be taken as the gospel, but they should certainly give pause to growth investors so confident in their beliefs that tech stocks will continue to dominate the market.
Fueled by strong fundamentals, tech stocks have enjoyed phenomenal returns in recent years. Starting around two years ago or so, retail investors really started jumping on the bandwagon, pushing prices even higher in a self-reinforcing cycle. Social media has given rise to what I’ve called the “memeification” of trading, as traders have posted their winning trades along with humorous images and GIFs to platforms like Twitter and Reddit. None of these has been more successful, controversial, or hilarious as Reddit’s r/wallstreetbets, whose user base has grown exponentially since 2017 to become one of the largest internet forums in the world today. There, users swap profanity-laden trading ideas, stories of gains or losses, rumors and rants along with equally offensive memes and videos, often declaring “Stonks only go up!” (the purposefully misspelled “stonks” referring to common equities) and “[Stock name] is about to go to the moon!” As all this has been going on, participation among retail investors in the market has been growing steadily. Then last fall most of the major brokerages eliminated commissions on stock trading, something I wrote about at the time. Most brokerages saw significant upticks in trading right away, mostly among smaller individual investors.
And then the pandemic hit and the floodgates were opened. Forced to stay home, millions of Americans with lots of extra time on their hands started opening brokerage accounts at never-before-seen rates. Can’t go to the casino? Try gambling on stocks! Got extra money from your stimulus check? Use it to buy stocks! Never invested in anything before? Trade options! Since the start of the pandemic retail trading has skyrocketed, and now accounts for as much as 25% of the markets’ daily volume, more than double what it was last year. Most of this has been short term speculation and concentrated in high-flying growth stocks, all encouraged by a social media ecosystem that actively encourages the belief that day trading is “the easiest game” there is and anybody can become a millionaire doing it. And all of this madness is set against the backdrop of markets at all-time high valuations as the economy is in the midst of a once-in-a-century slowdown. This pretty much checks all the boxes for classic signs of a bubble, then creates new ones and checks them off as well.
Stocks cannot ignore reality forever. Ultimately, valuations do matter. As it stands right now, the majority of the world’s stocks appear more or less reasonably valued. But many of them, the ones that have been the most popular, attention-getting names that have made people the most money recently, appear to have lost all contact with reality and are dangerously overvalued.


