
America is more divided now than ever, a hostile foreign power is openly threatening us with nuclear weapons, and we don’t even know what next year’s tax rates will be. In this era of acrimony and uncertainty, surely the market must be a roller coaster ride of volatility and risk right now…
Hahaha yeah right.
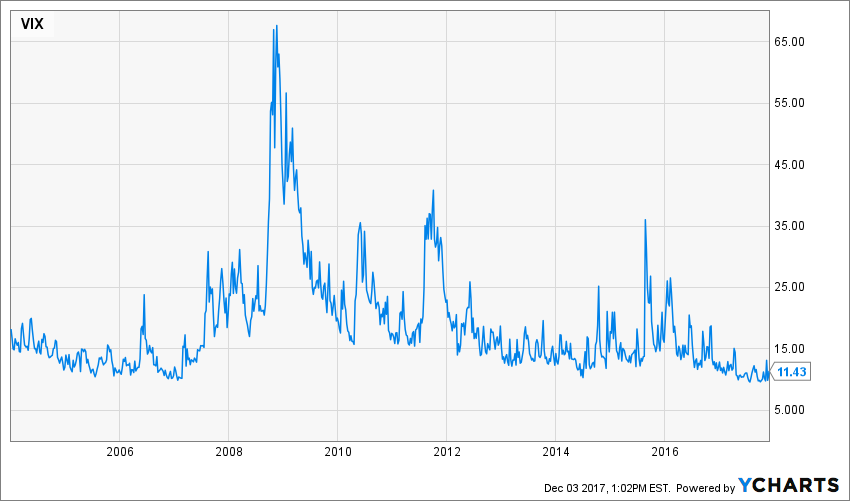
That’s the VIX, the Volatility Index, a measure of investors’ expectations of volatility on the S&P 500 based on option price data. Notice how the most recent readings are some of the lowest on the chart. In fact, the VIX reached an all-time low earlier this year, and it has remained near the bottom of the barrel throughout 2017. Any way you measure it, 2017 has been one calmest years on record for financial markets. The worst one day return this year, for example, was -1.77% on May 17. Over the previous 20 years, however, there have been 316 days with lower returns than this, including 16 days with returns lower than -5%. Or we can look at maximum drawdowns – the greatest fall endured from a previous peak price – by year. The following chart displays the worst drawdowns on the S&P 500 each year since 1997:
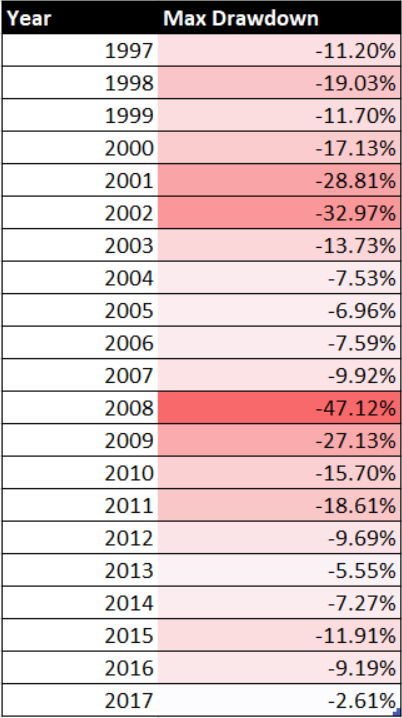
Most years witness periods of double-digit negative returns at some point. With less than one month left to go in 2017, the worst drawdown we’ve suffered so far was a measly -2.61%, a figure we normally associate with just a bad day, and less than half that of the next-least-bad year of 2013.
And it’s not just US stocks. Markets around the world have been remarkably calm this year, with recent volatility at or near record lows on assets as diverse as emerging market stocks, treasury bonds, gold, high yield debt, and the euro to dollar exchange rate. Pretty much the only market that’s experienced any significant volatility this year is bitcoin.
So why is volatility so low right now? That’s the hot question of the day among the financial press, and metaphors of the calm before the storm abound. But I think the more interesting question is actually why volatility was ever so high in the first place.
In 1980 the economist Robert Shiller wrote a highly influential paper called “Do Stock Prices Move Too Much to be Justified by Subsequent Changes in Dividends?” According to basic finance theory, the price of a stock should be equal to the present value of all its future dividends. Because we obviously can’t know for sure how much we’ll earn in dividends in the future, stock prices will fluctuate based on news relevant to the dividend stream. News of a recession, for example, may mean a lower level of dividends in the future and so result in a fall in stock prices. But do prices rise and fall at a rate commensurate with future changes in dividend payments, or do they tend to overreact? To answer this question Shiller compared the deviations from trend of the aggregate dividends paid on S&P 500 companies against changes in the price level of the index over a century plus long period. This is what he found:
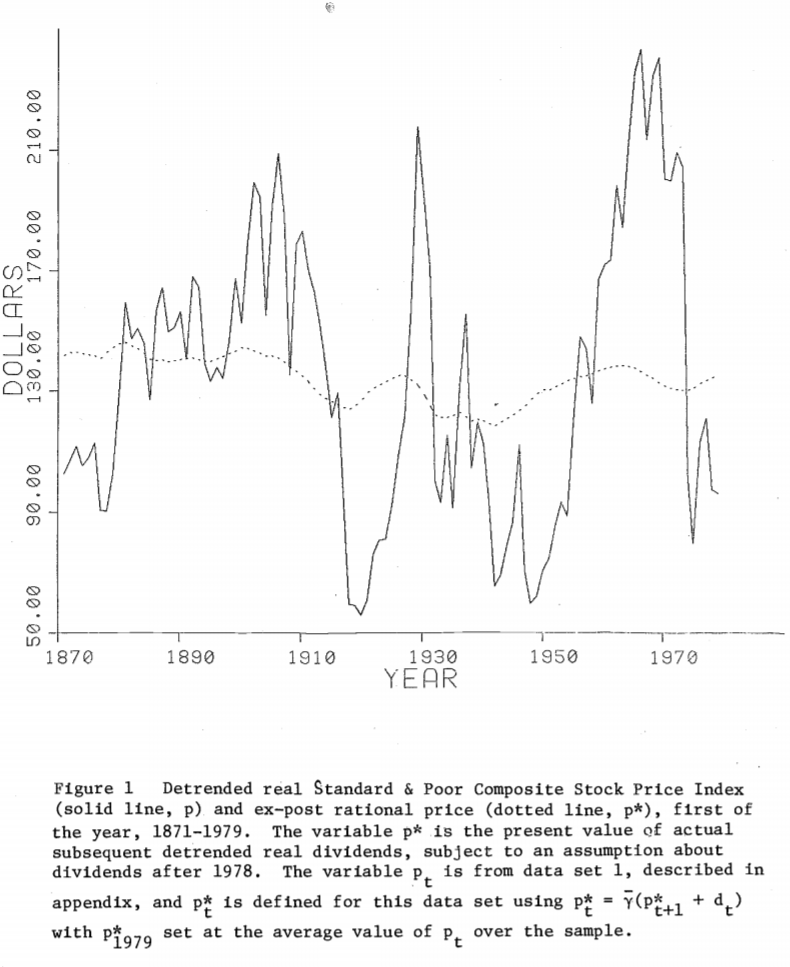
Dividend payments do ebb and flow somewhat with the business cycle, but overall the income earned on a diversified index of equity investments is a relatively stable and predictable variable. Stock prices, on the other hand, are all over the map, subject to the booms and busts we are all familiar with. In other words, it would seem that stock prices have historically been far more volatile than their underlying fundamental economic value. Shiller referred to this finding as “excess volatility” and used it as a launching pad for an academic career spent studying investor irrationality and market hysteria. In 2013 he received the Nobel prize for his efforts and is today considered one of the foremost authorities on economic bubbles.
Somewhat ironically, Shiller’s thesis, written in 1980, came on the eve of the “Great Moderation.” Beginning in the early ’80s, the volatility of macroeconomic variables such as economic growth – already much lower than stock market volatility – began to decline. In 2004 then-future and now-former Federal Reserve chairman Ben Bernanke popularized the term Great Moderation and credited the previous two decades of relative stability to a better execution of monetary policy on the part of central bankers like himself. This came back to haunt him a few years later as the 2008-09 financial crisis seemed to blow holes into the notion that the economy had become anything close to moderate, much less greatly so. The Great Moderation hypothesis fell out of favor after 2008, but with a decade of data in the rear-view mirror now, let’s take another look. Below is a plot of quarterly GDP growth in the United States since 1947.

US GDP Growth data by YCharts
Just eyeballing a graph like this, it’s clear that economic growth over the last 30 years has been much more stable than in the previous 30 years, even with last decade’s financial crisis. More formally, we can look for example at how the standard deviation (a statistical measure of volatility) of GDP growth has evolved over time. In the following chart I plot the trailing 20 quarter (five year) standard deviation of quarterly GDP growth in the US.
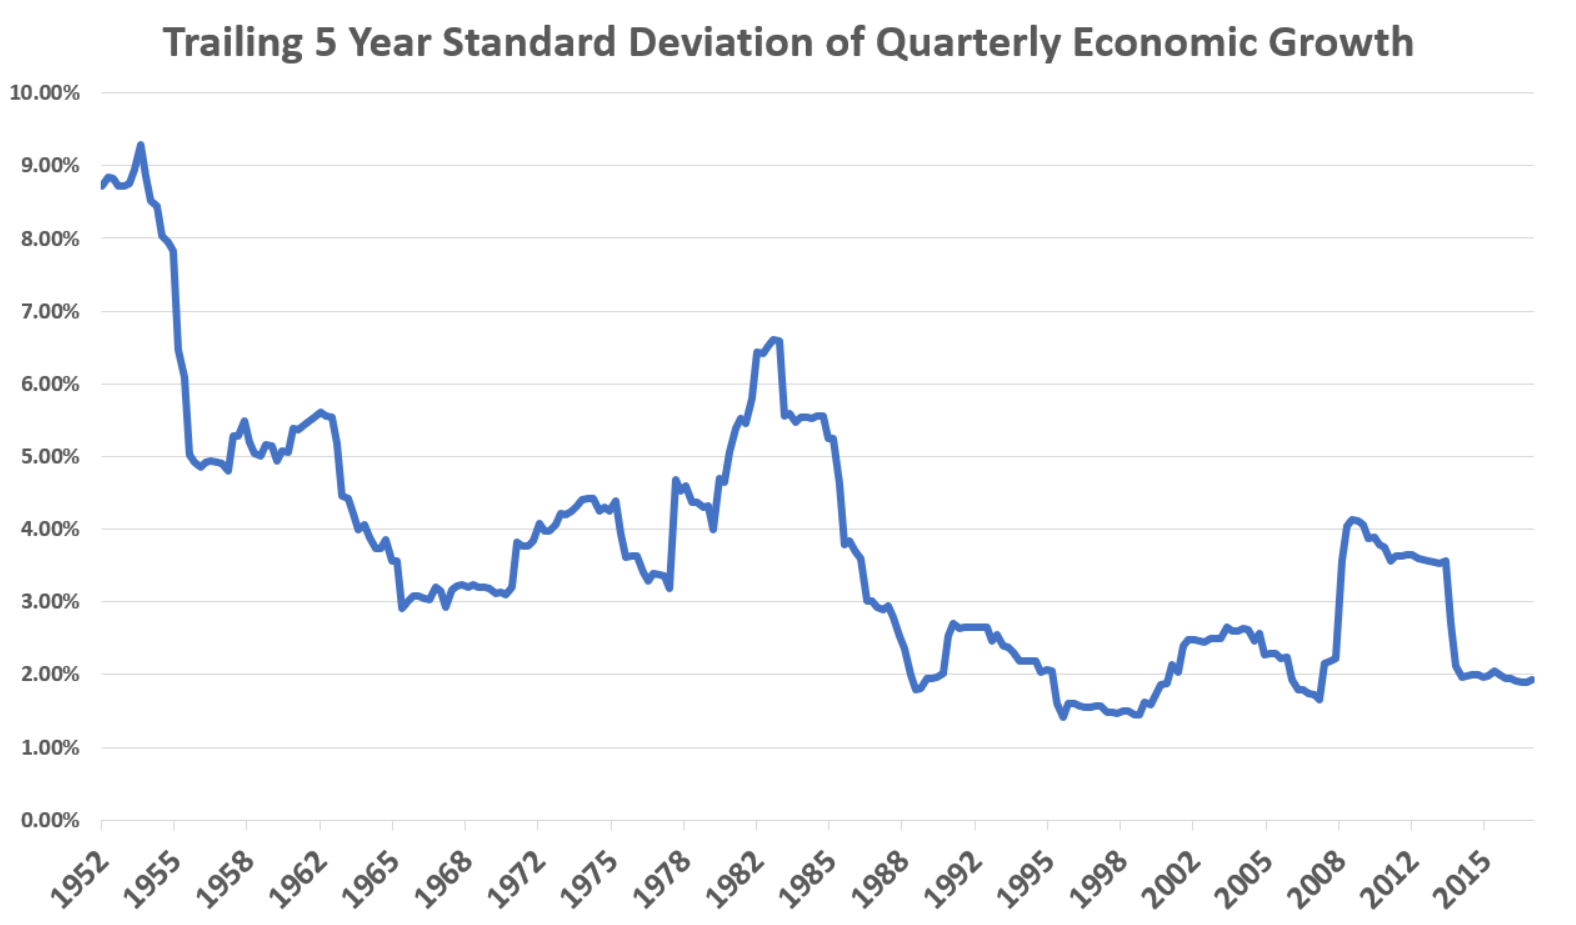
Even with the financial crisis, recent economic volatility has been lower than it ever was in the supposed economic golden age of the 1950s, and the latest figures are close to their all-time lows. Similar trends have been playing out in other major, economically advanced nations as well.
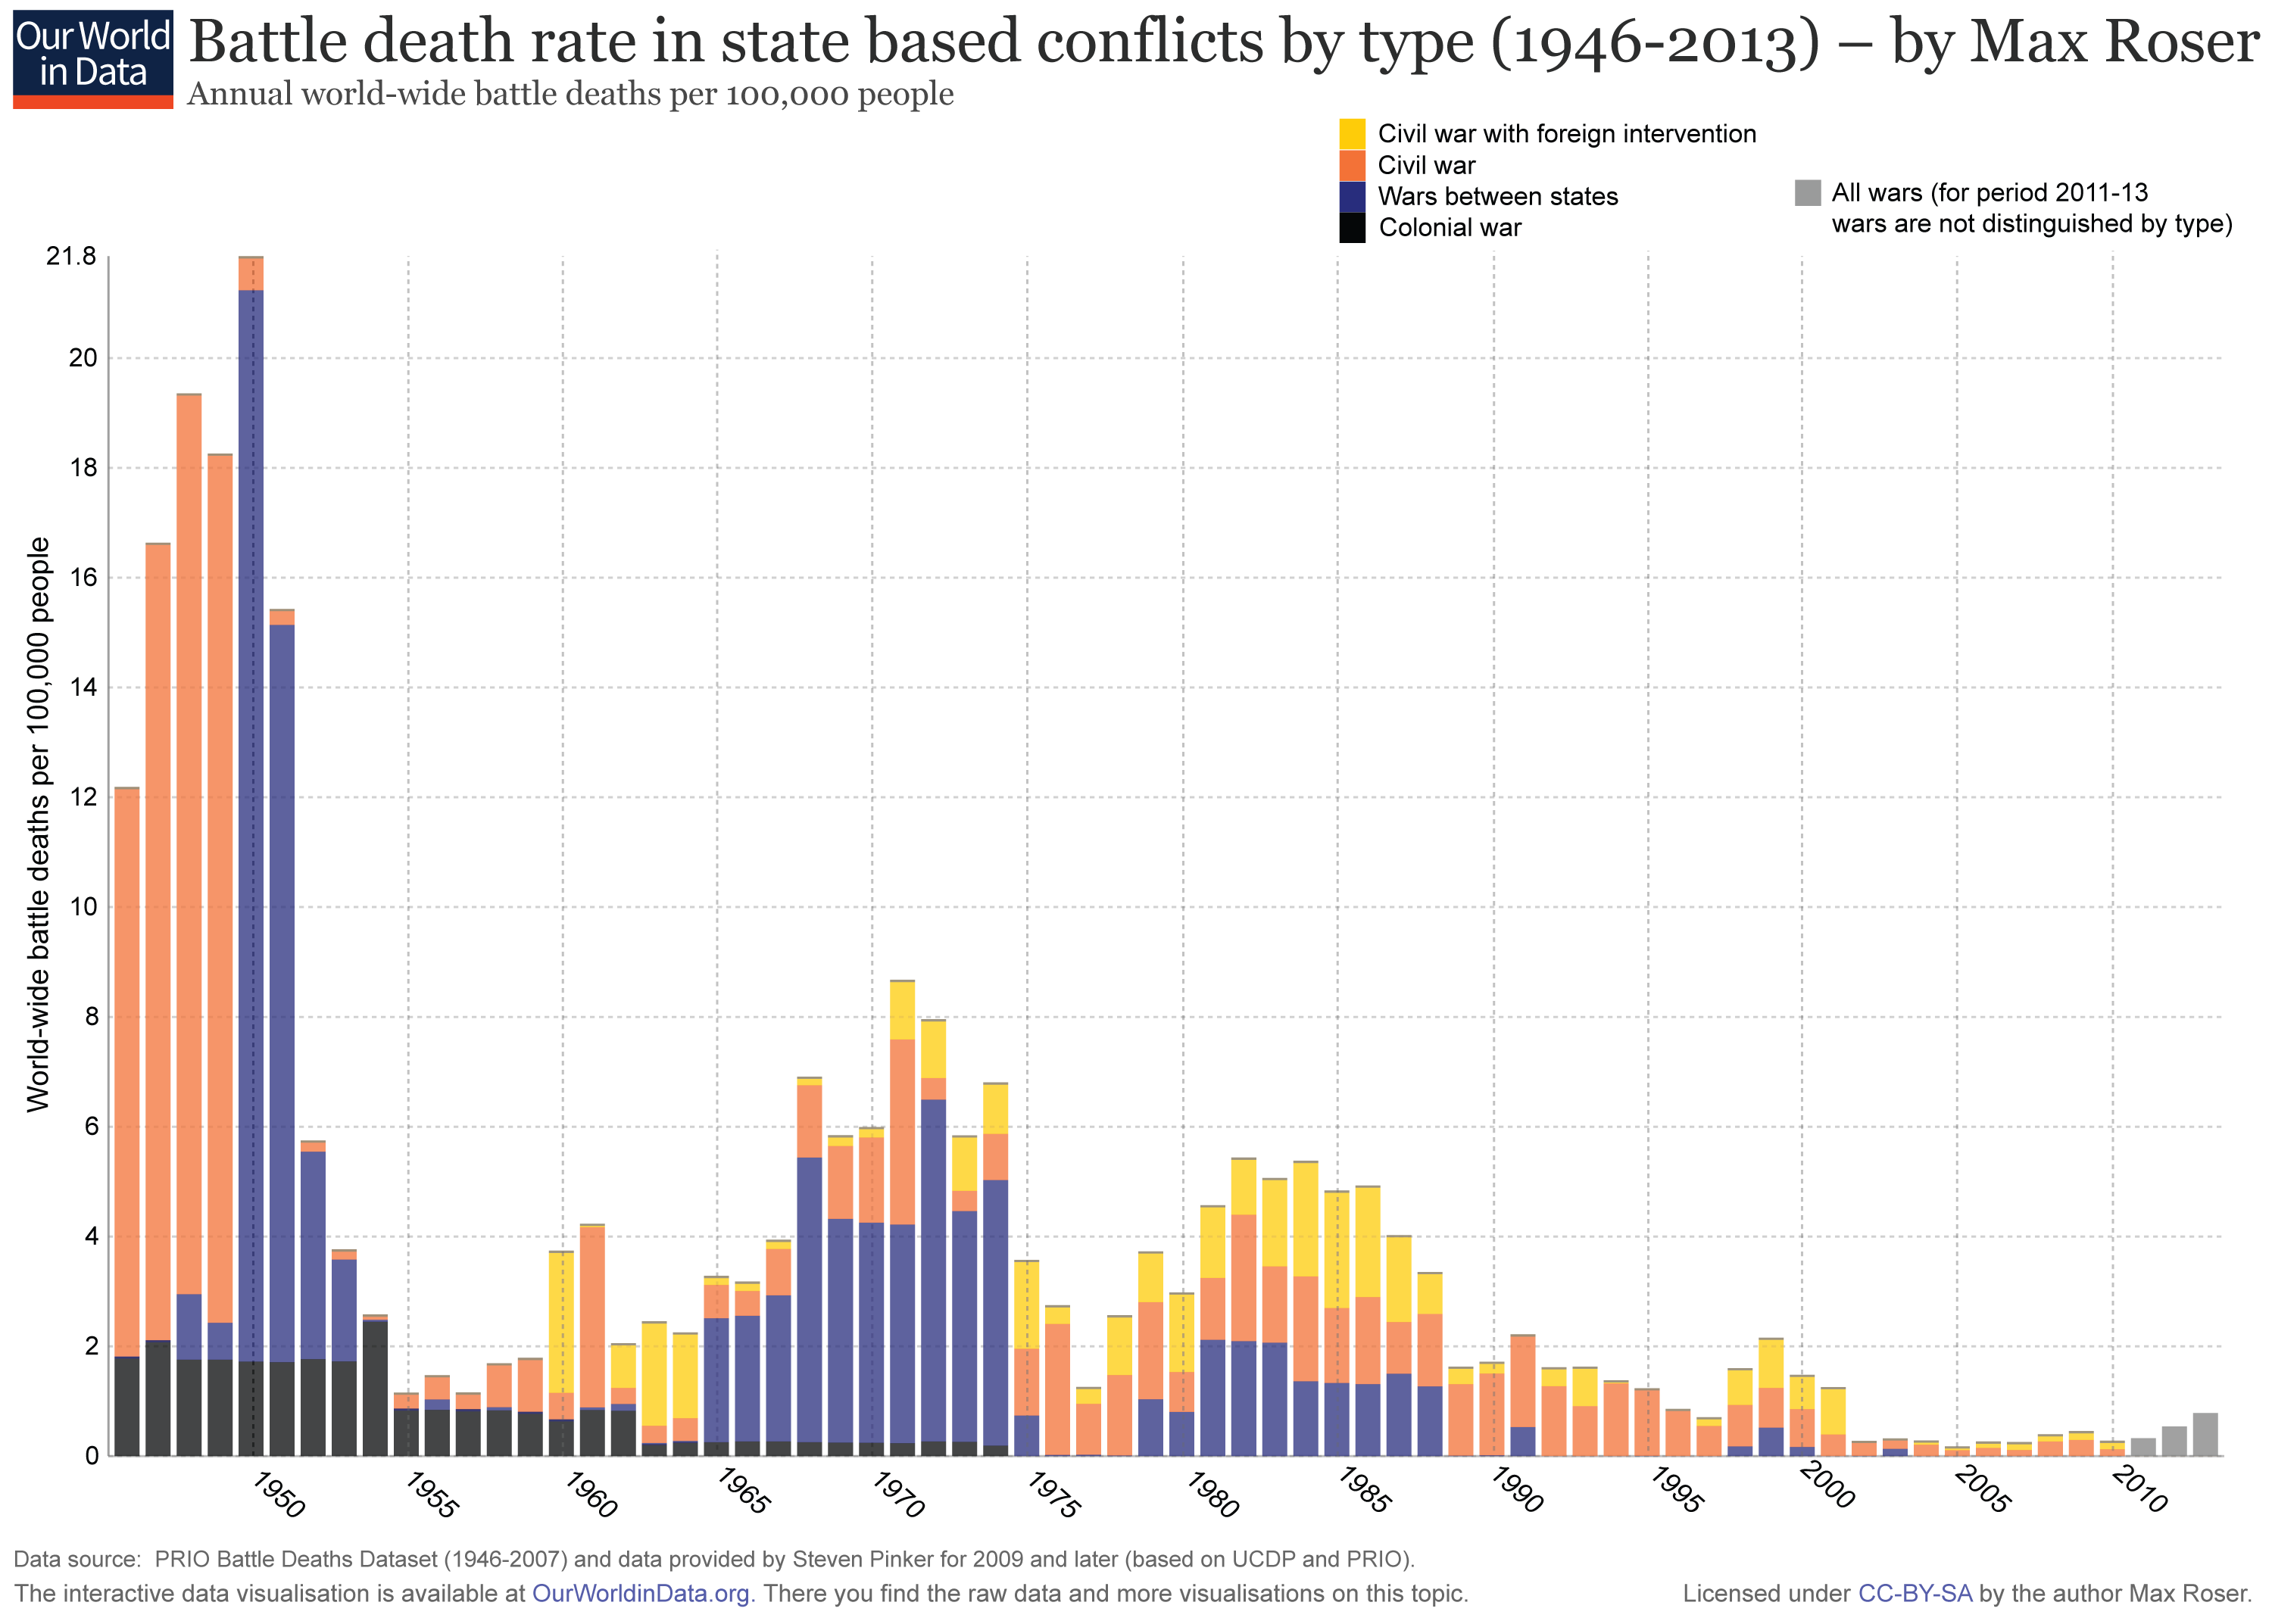
It’s not just macroeconomics. In many ways our world is becoming safer and more stable as the years go by. One hundred years ago all of the world’s major powers were locked in armed conflict with one another in the First World War. Now, full-on violent geopolitical conflict is becoming vanishingly uncommon and the number of deaths as a result of interstate and civil war is falling towards zero.
People live longer and more peaceful lives these days, and are more likely to live under a democratic form of government.
Democracies are more likely to lead to stable and predictable institutions, and to foster more stable economic growth. Thus, as the world has democratized more and more, the world economy has become more robust. With this we have seen a flourishing of national stock markets; MSCI now tracks stock market indexes on over 80 countries, and international investors can now easily use ETFs to invest in new markets as wide-ranging as Vietnam, Egypt, Columbia, and Qatar.
Financial innovation itself, though often treated as a bogeyman, is likely to also be a stabilizing force in the markets. Just a generation ago, most investors simply held a handful of individual stocks in their portfolio, often resulting in large concentrations of risk. Since 1980 though, we have seen widespread adoption of mutual funds and ETFs as these products have become far more competitive.
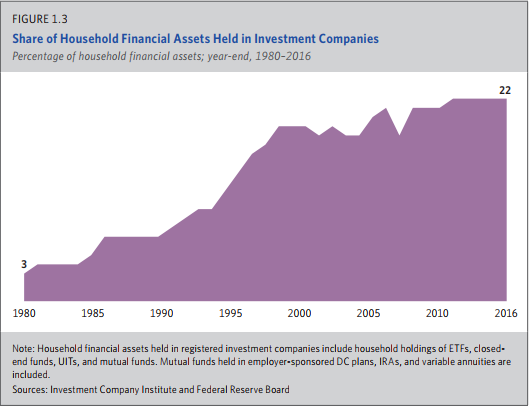
Source: ICI 2017 Fact Book
It’s now trivially easy for US investors to get inexpensive, broadly diversified access to the world’s stock, bond, and alternative asset markets. Perhaps the greatest boon to ordinary investors in the new millennium has been the ascent of “target-date” and “lifestyle” funds, which provide cheap, globally diversified all-in-one solutions to investors based on their age or risk tolerance. These funds, which barely existed 20 years ago, now contain over $1.2 trillion in assets, mostly in 401(k) plans, where they are often the default option. There is evidence that these solutions also encourage better investor behavior: while investors’ predilection has always been to buy high and sell low, sabotaging their own returns and exacerbating market volatility, investors in balanced index funds such as target-date funds have largely bucked that trend, avoiding the panic selling we typically see during market downturns.
So, the world has become more stable, resilient, democratic, and peaceful. Investors have in turn become better diversified and enabled to take more appropriately calculated risks. To my mind, then, it makes sense that the market should be less volatile now than ever before. The world is just a less risky place these days.
Does this mean that you don’t have to worry about ever losing more than 2.61% in the stock market ever again? NO. Markets will rise and fall as they always have, as surely as the leaves will fall in the Autumn and the flowers will bloom in the Spring. Sooner or later volatility is bound to tick back up again, but when it does perhaps it will not be so violent as times past. As time passes and the lessons of history accumulate, perhaps we grow wiser and stronger. Perhaps tomorrow is not as perilous as it seemed just yesterday.
Disclosures: This post is solely for informational purposes. Past performance is no guarantee of future returns. Investing involves risk and possible loss of principal capital. No advice may be rendered by RHS Financial, LLC unless a client service agreement is in place. Please contact us at your earliest convenience with any questions regarding the content of this post. For actual results that are compared to an index, all material facts relevant to the comparison are disclosed herein and reflect the deduction of advisory fees, brokerage and other commissions and any other expenses paid by RHS Financial, LLC’s clients. An index is a hypothetical portfolio of securities representing a particular market or a segment of it used as indicator of the change in the securities market. Indexes are unmanaged, do not incur fees and expenses and cannot be invested in directly.

