
Not that long ago, most economists would have probably argued that it’s impossible for a bond or other interest-paying asset to sell at a negative yield. After all, why on earth would you lend somebody money with the explicit understanding that they will give you back less than you started with? Even if there aren’t any better investment opportunities available, wouldn’t it be better just to let your money sit in cash and maintain its balance? 0% is better than less-than-nothing.
Well as it turns out that argument can’t be right because there are now about $10 trillion worth of bonds in the world currently trading at negative yields.
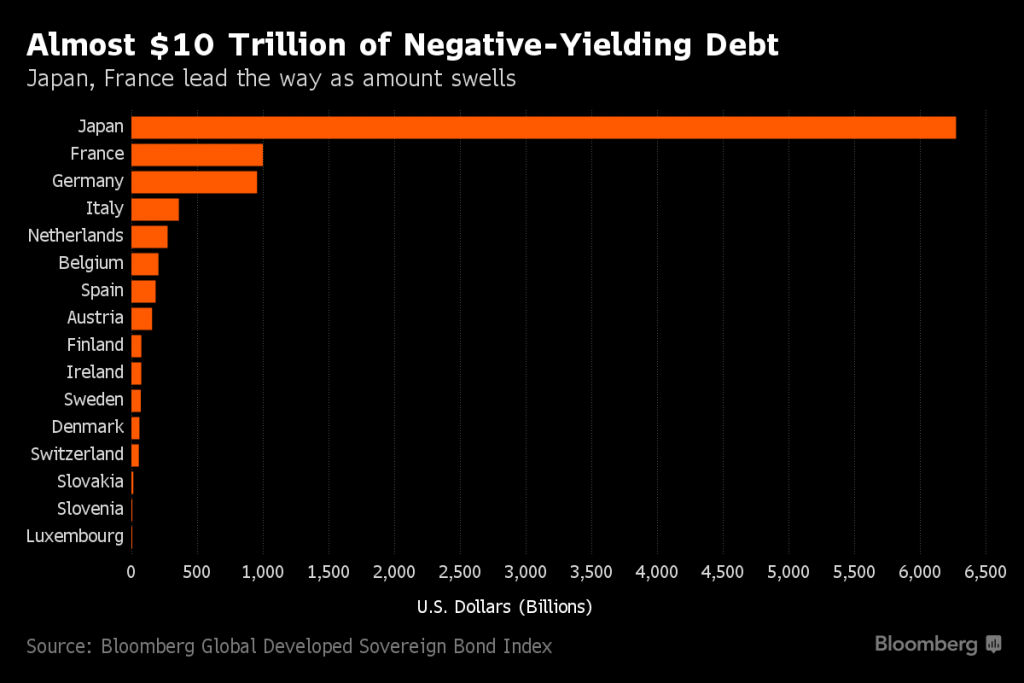
Dropping below zero first in Switzerland in the summer of 2014, something like a quarter of the world’s sovereign debt is now in negative yield territory, and recently even some corporate bonds have gone negative. What’s going on here? Have bond investors around the world completely lost their minds? Why is anybody willing to pay for the privilege of lending their money to Japanese and European governments?
The go-to answer seems to be about convenience. If you’re a major bank or insurance company, you’re working with billions of dollars; it’s not so simple to hold a pile of cash that big. Planet Money recently had an amusing podcast about this, and pointed out how once you factor in the cost of storing your cash in vault and insuring it, you’re effectively paying a negative interest rate with that option as well. Government bonds, on the other hand, are essentially the currency that major financial institutions transact with each other with, and maybe negative yields are just the cost of doing business these days.
Others point out that banks and insurers are essentially forced by regulations like the globally enforced Basal Accord to set aside a significant portion of their capital in government bonds. With central banks around the world engaged in persistent monetary stimulus to rekindle economic growth, the financial industry has little choice but to accept the negative rates on offer and bleed a little bit.
I have another explanation: sovereign bonds around the world are trading at negative yields today because high-quality sovereign bonds are excellent insurance against equity market risk right now, and you generally have to pay for insurance.
Let’s look at the US first: we don’t technically have negative yields here (yet), although the same principle is at work and it’s easier to get data here. Below is the same chart I showed last time of the yield on the 10 year treasury bond since 1980:

As you can see, interest rates have fallen a great deal over the last few decades, and once you factor in the inflation rate the 10 year treasury has a negative real yield. But the yield isn’t the only thing that has dropped on T-Bonds, so has their riskiness. Below I plot the same yield figures as above against the 10 year correlation between the returns on long-term treasuries and the S&P 500 (on the right axis).
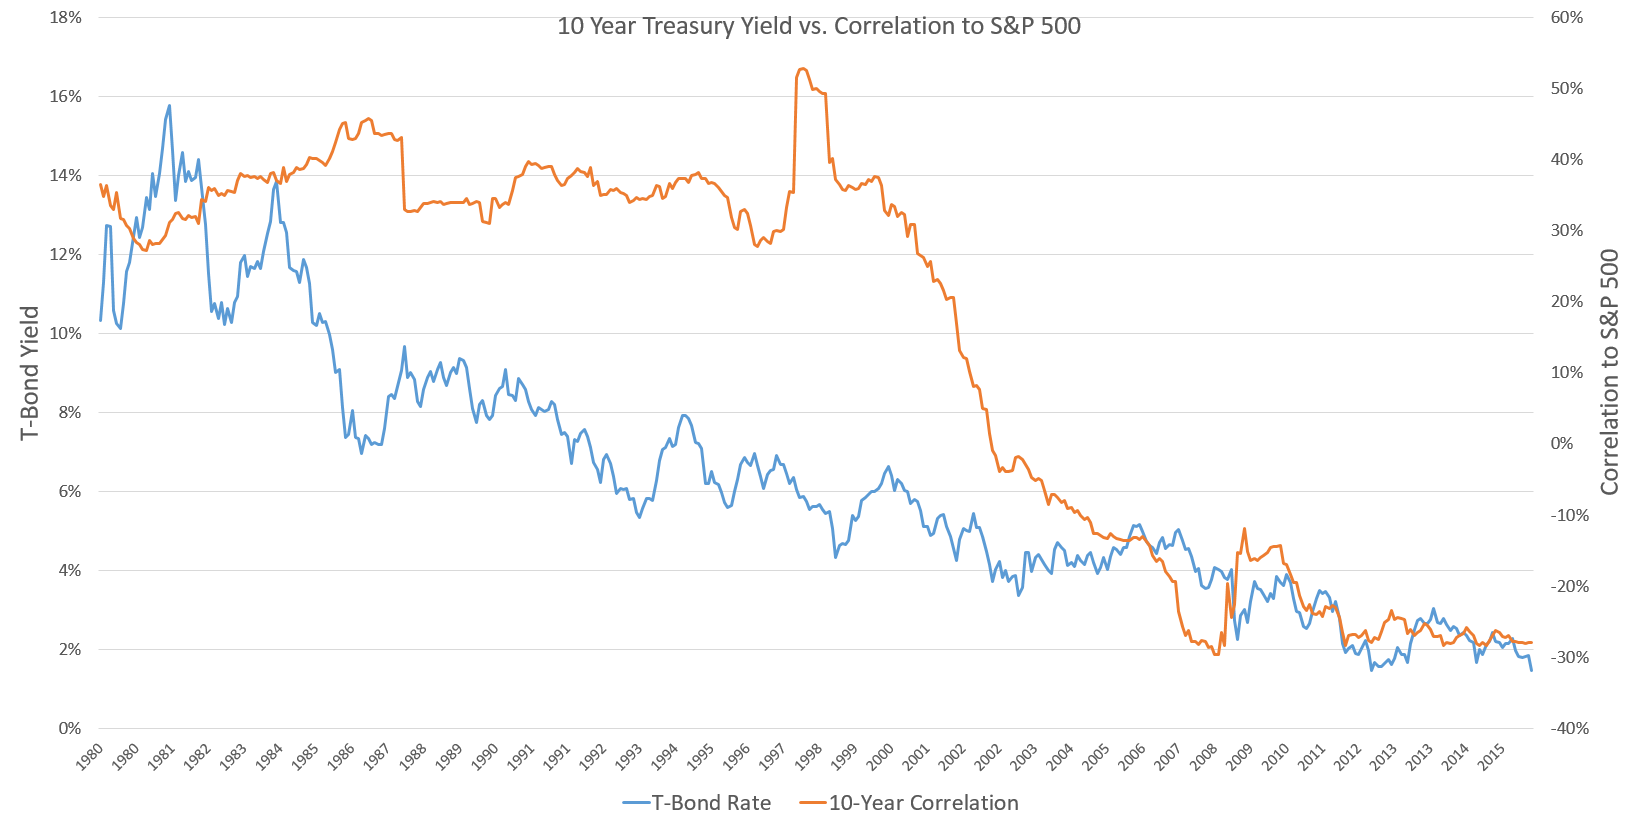
As the yields on government bonds have fallen, they have begun to provide a better hedge against stock market drawdowns. In the 80s and early 90s the correlation between stocks and bonds hovered around 40%, not very high but that still means the two assets moved in the same direction on average. After the bursting of the dot-com bubble treasuries provided a safe-haven against the massive losses stocks were accumulating, and correlations fell below zero. During the financial crisis of ’08-’09 the correlation plunged further still as government bonds were one of the only assets that went up during the panic. The correlation has remained in the -20% to -30% range ever since, meaning that when the stock market is falling, treasuries are likely to be rising, and vice versa, making them an excellent risk management tool when building a portfolio. The same is not true for cash, which simply stays constant, come rain or shine.
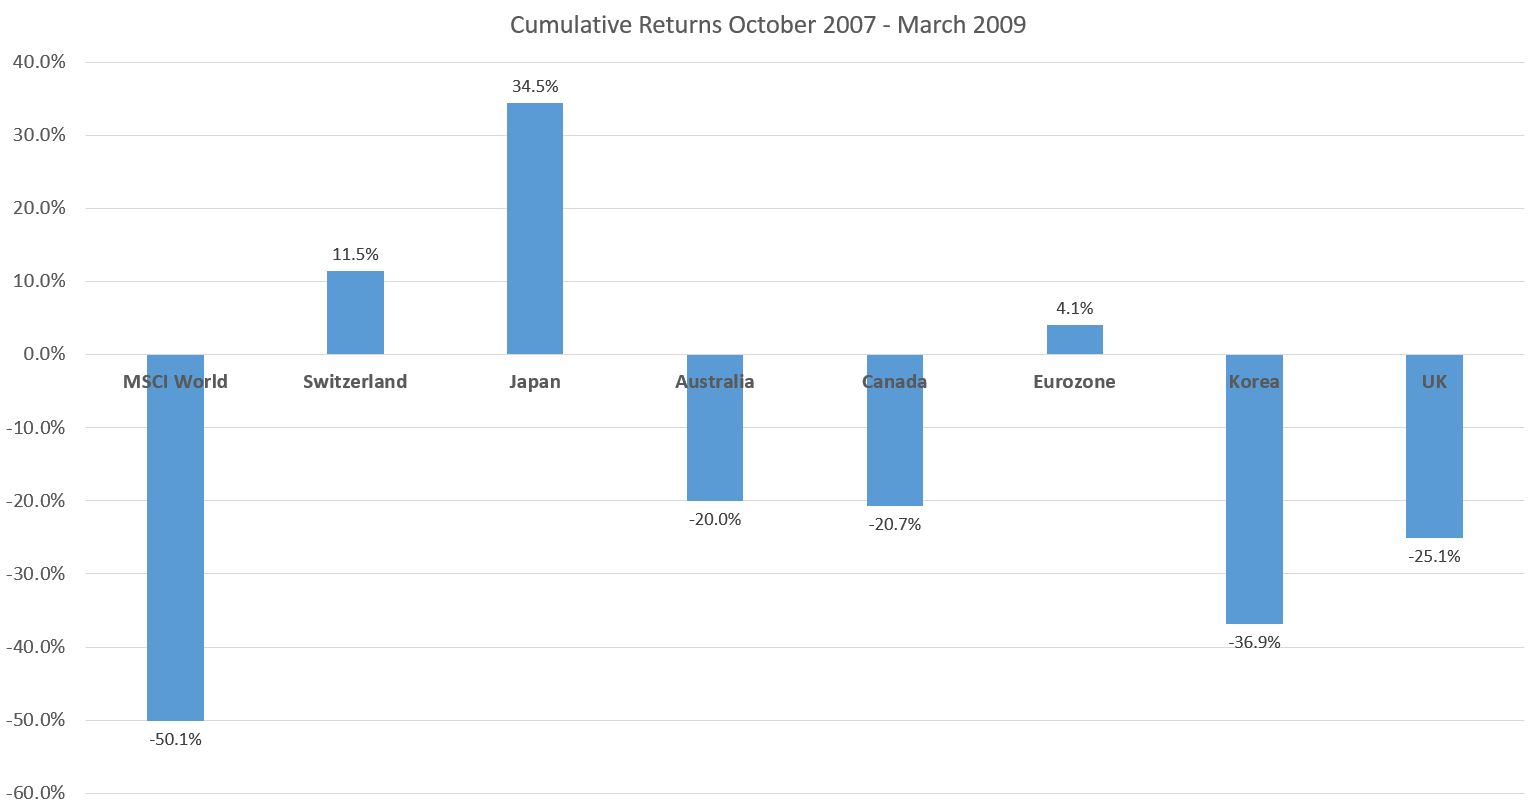
This same dynamic is at work in most major developed markets around the world. The sovereign debt of highly developed nations tends to be negatively correlated to world stock markets and provides a good hedge against crises and panics. When we’re looking at international markets, exchange rates add an additional layer to consider. What we find is that the places with the most pervasive negative yields, namely Japan and Switzerland, are countries with safe haven currencies that provide additional protection during times of market distress. The next two charts shows the performance of developed market stocks (MSCI World index, in USD) during the last two major crashes alongside the appreciation/depreciation of several major currencies on their trade-weighted or effective exchange rate. (Effective exchange rates are a weighted average of a country’s exchange rate against the currencies of its major trading partners, and so they better capture how a currency looks from an average person anywhere in the world, rather than simply converting everything into dollars).
First, during the financial crisis:
And during the Eurozone debt crisis:
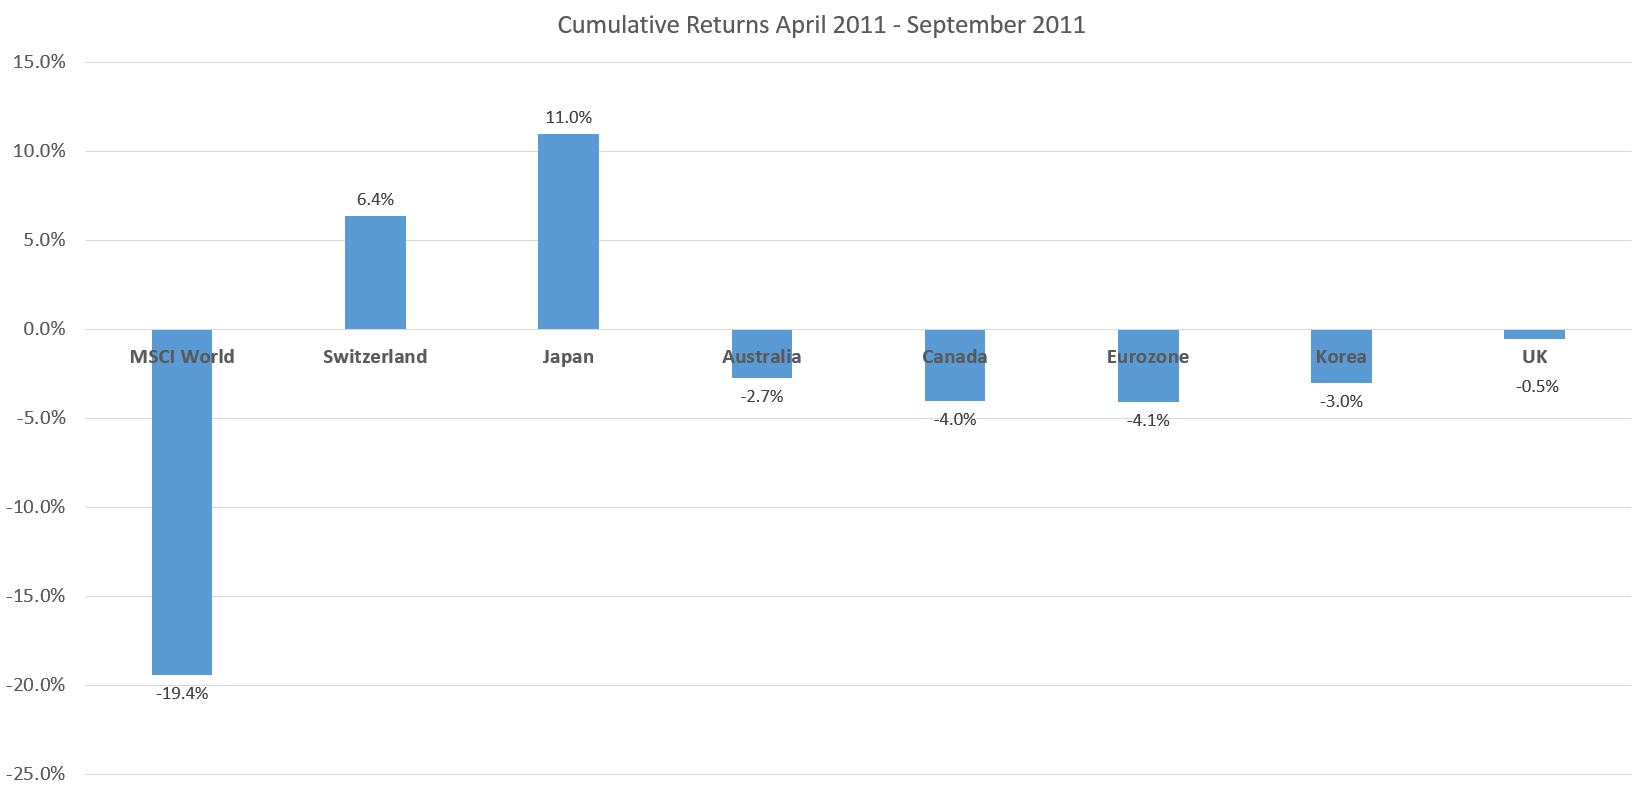
As you can see, the yen and the franc did quite well during the last two major market downturns. Investors quite understandably view the politically, culturally, and economically stable nations of Japan and Switzerland as the places to go when the rest of the world looks like it’s falling apart. As a result they’re offering to pay their governments to borrow money for 20 years or more.
You may at this point want to accuse me of just pushing the question back one step. So yields around the world have fallen because stock-bond correlations have fallen. But then why have correlations fallen? Let’s return to the US and zoom out a bit. Below I plot three data series going back to 1935: The yield on the 10 year treasury and the average inflation rate over the previous 10 years on the left axis, and the correlation with the S&P 500 over the last 10 years on the right axis. (Prior to 1962 I had to use annual interval data for the T-Bond Yield, hence the flatter lines)
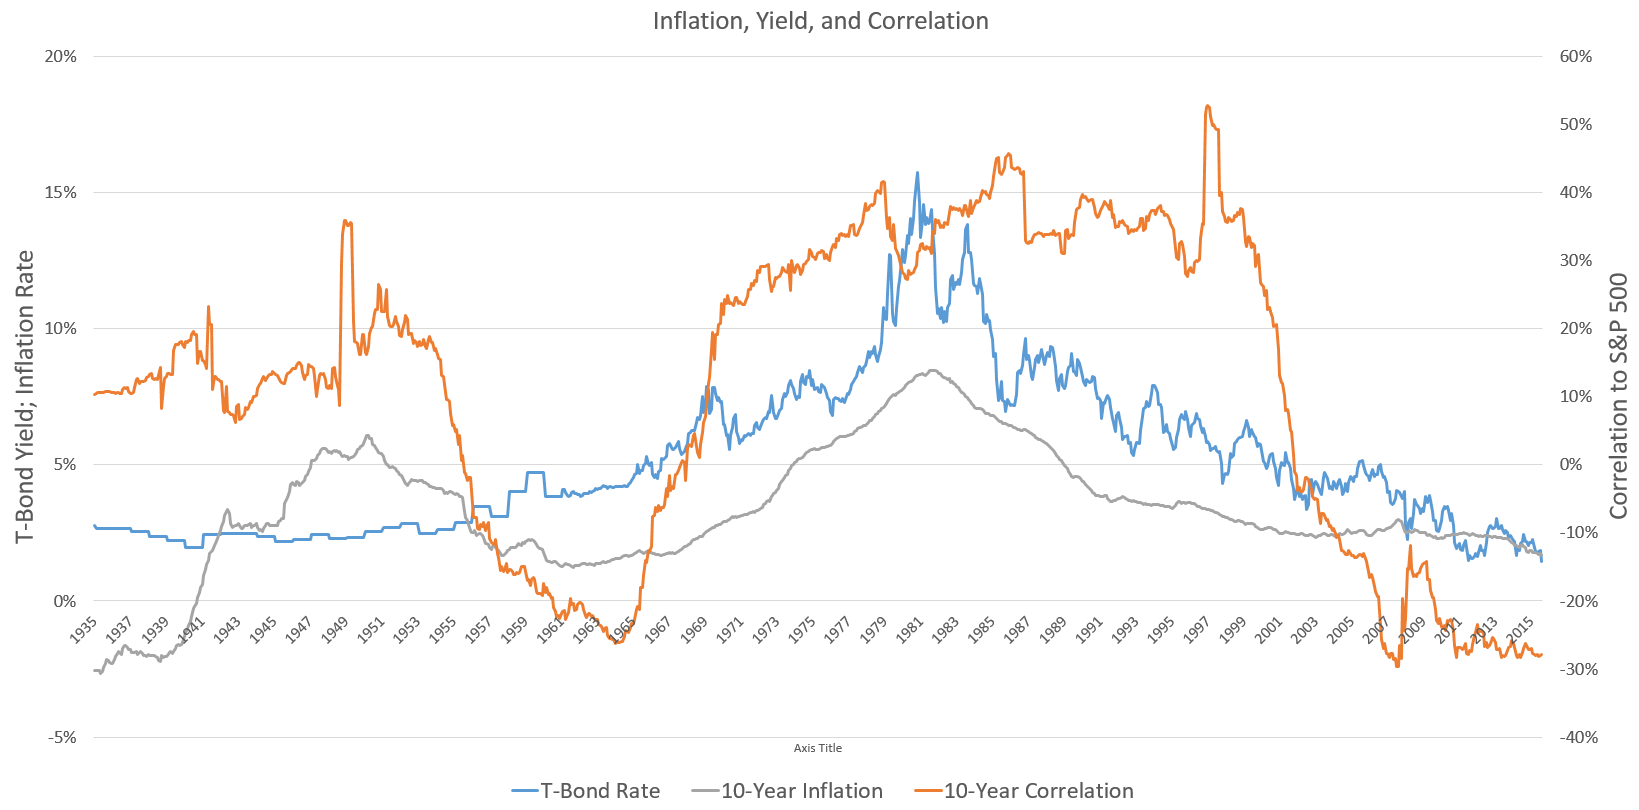
Though it’s not a perfect fit, these variables clearly move together with each other. When inflation is high, yields are high too, and stocks and bonds move in more or less the same direction. When inflation is low or negative, yields are low and bonds move in the opposite direction as stocks.
There is a perfectly good economic explanation for this. Inflation is one of the key macroeconomic factors that governments, consumers, and investors are all interested in, and it affects various assets differently. High inflation is bad for the economy and for stocks, as companies are forced to pay higher prices for their key inputs and may find certain resources in short supply. High inflation is also bad for bonds, as bonds are a nominal asset that only pays out a certain fixed amount of money, an amount that is worth increasingly less as inflation eats away at the value of the currency. So when inflation is major risk to the economy, as it was in the 70s and early 80s, both stocks and bonds will tend to react positively to news of decreasing inflation and negatively to news of increasing inflation. They’re correlations with be high, in other words. The only assets that do well in this environment are “real assets” like commodities and real estate (not pictured because it’s hard to get good long-term data). Inflation is good for commodity investors almost by definition, as inflation refers to a rise in prices of goods and services, and commodities such a petroleum, metals, and agricultural products are key inputs to almost all the goods we consume.
Deflation, on the other hand, is also bad for the economy and bad for the stock market, though the reason is less intuitive than for inflation. Though falling prices might seem like good news to everyone, it also means falling revenue for companies, who may find it difficult to pay back loans that are denominated in nominal terms. Employees are reluctant to accept lower wages and homeowners are loathe to sell an underwater house, so layoffs and capital allocation inefficiencies are common. Commodities also do poorly, again almost by definition. High quality bonds, especially government bonds, on the other hand, do well in a deflationary environment, because their fixed interest payments now are relatively more valuable as everything else becomes cheaper, so news about deflation risks will affect stocks and bonds differently and their correlation will turn negative.
Today in most of the developed world, especially Japan and the Eurozone, deflation is a much greater risk than inflation, as an aging population, lingering instability in the banking sector, and tight monetary policy (yes, you read that correctly) hang over the global economy like a dark cloud, making government bonds a valuable insurance policy investors are willing to pay up for.
Disclosures: This post is solely for informational purposes. Past performance is no guarantee of future returns. Investing involves risk and possible loss of principal capital. No advice may be rendered by RHS Financial, LLC unless a client service agreement is in place. Please contact us at your earliest convenience with any questions regarding the content of this post. For actual results that are compared to an index, all material facts relevant to the comparison are disclosed herein and reflect the deduction of advisory fees, brokerage and other commissions and any other expenses paid by RHS Financial, LLC’s clients. An index is a hypothetical portfolio of securities representing a particular market or a segment of it used as indicator of the change in the securities market. Indexes are unmanaged, do not incur fees and expenses and cannot be invested in directly.


