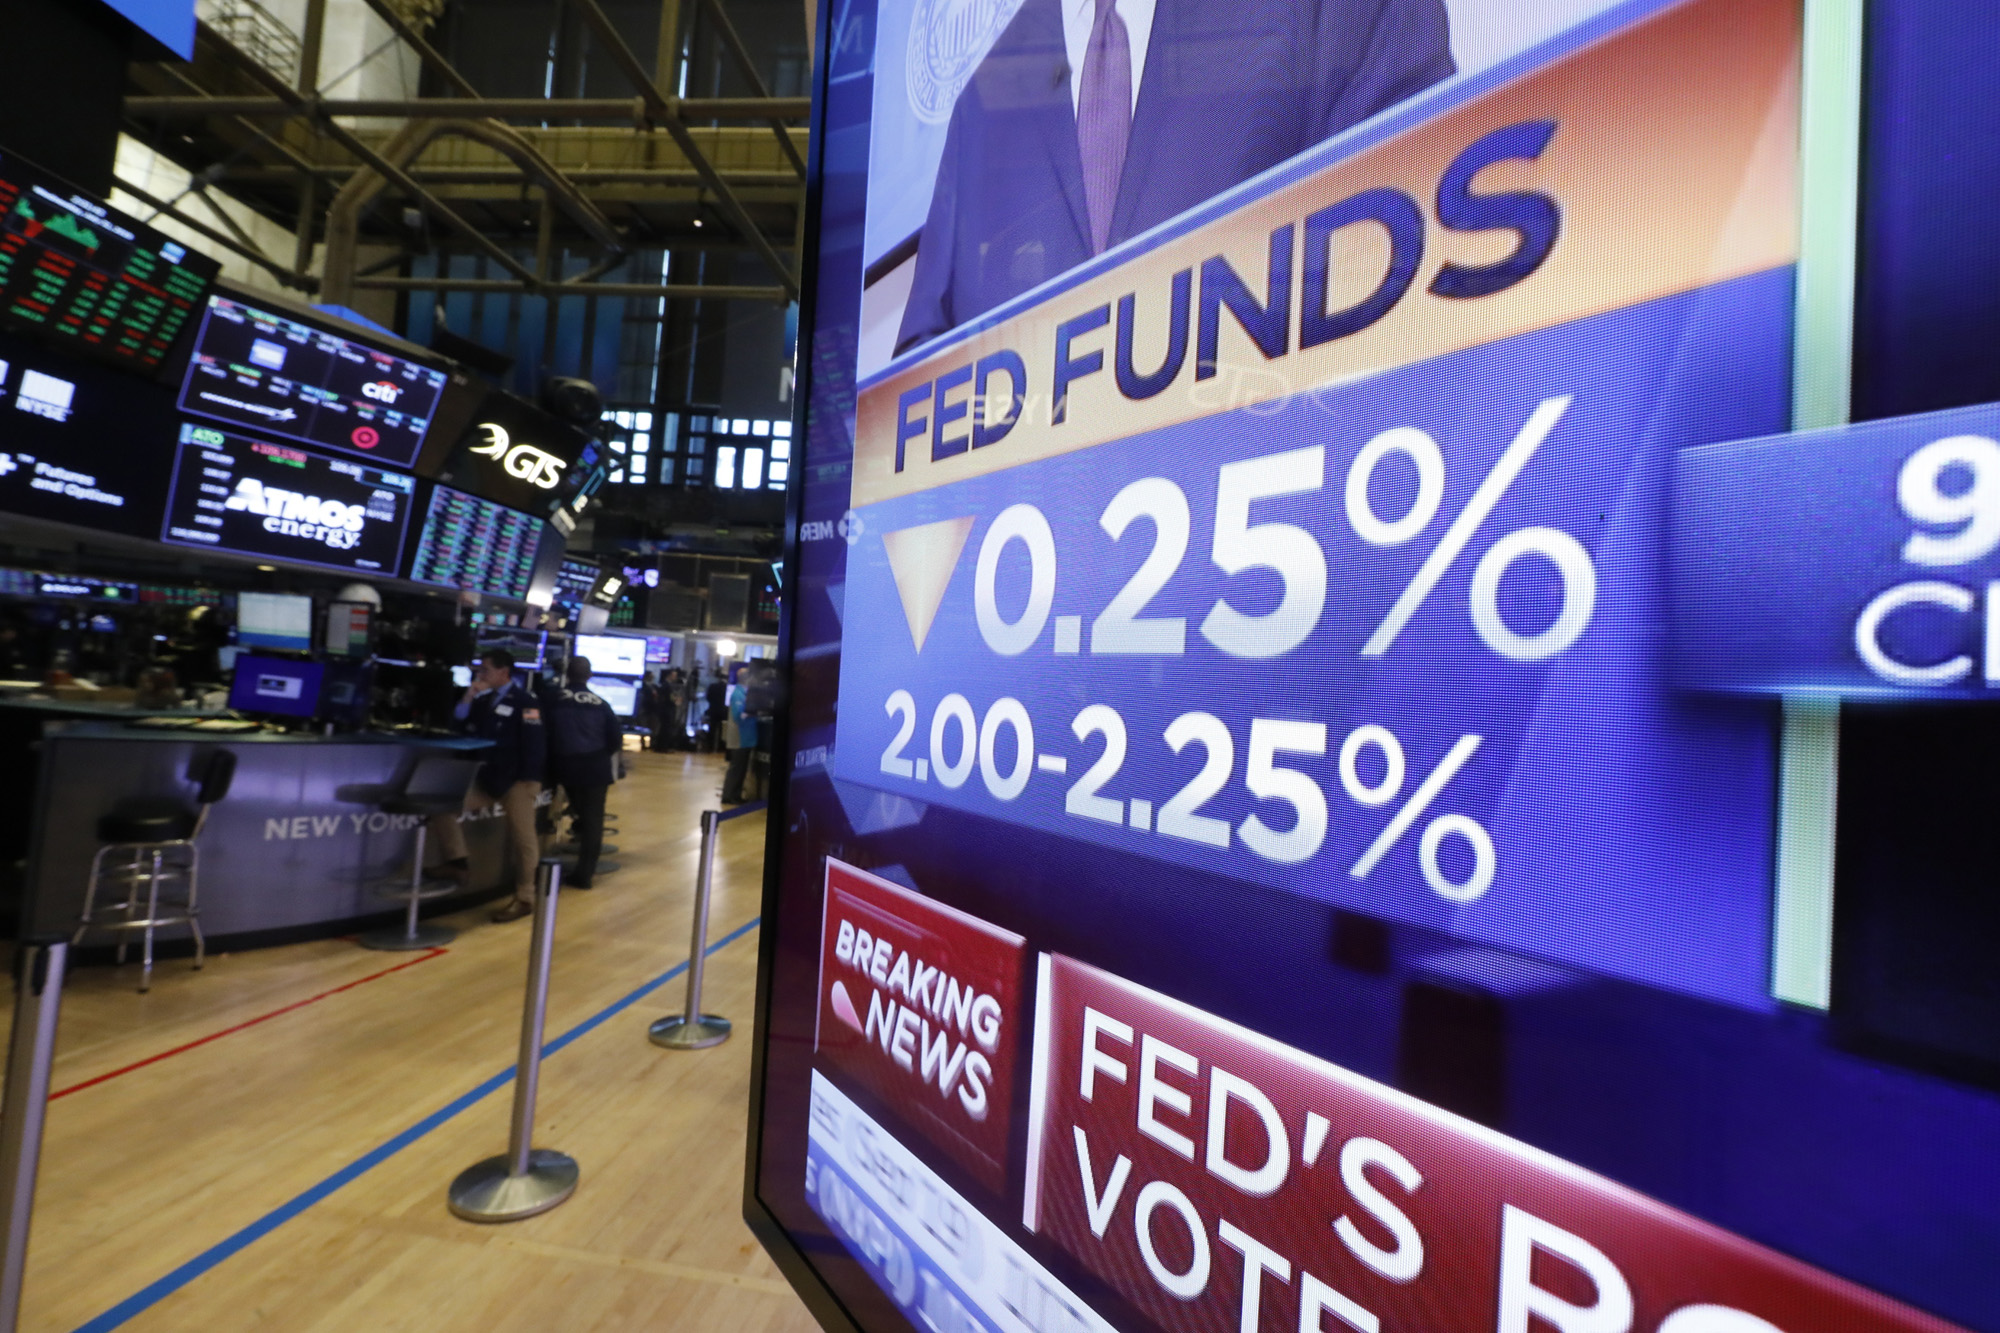
Last Thursday, the yield on the US 30-year treasury bond fell below 2% for the first time in history, breaking its previous record set in 2016. Predictably, everybody is losing their minds because of this. Bloomberg says that the 30-Year Treasury is Scary, and this is like cats sleeping with dogs or the sun rising in the west or something. Back in 2016 I wrote about how these low-to-negative rates on government bonds aren’t actually all that mysterious from the perspective of a portfolio manager. Today I’ll dive a little deeper into that perspective and make the claim that interest rates today actually aren’t really low at all once we account for the other side of the financial equation: risk.
Long Term Interest Rates in the Long Run
Here’s the history of long term interest rates in the United States since 1926, as proxied by the yield on an index of treasury bonds with 20 to 30 years to maturity:
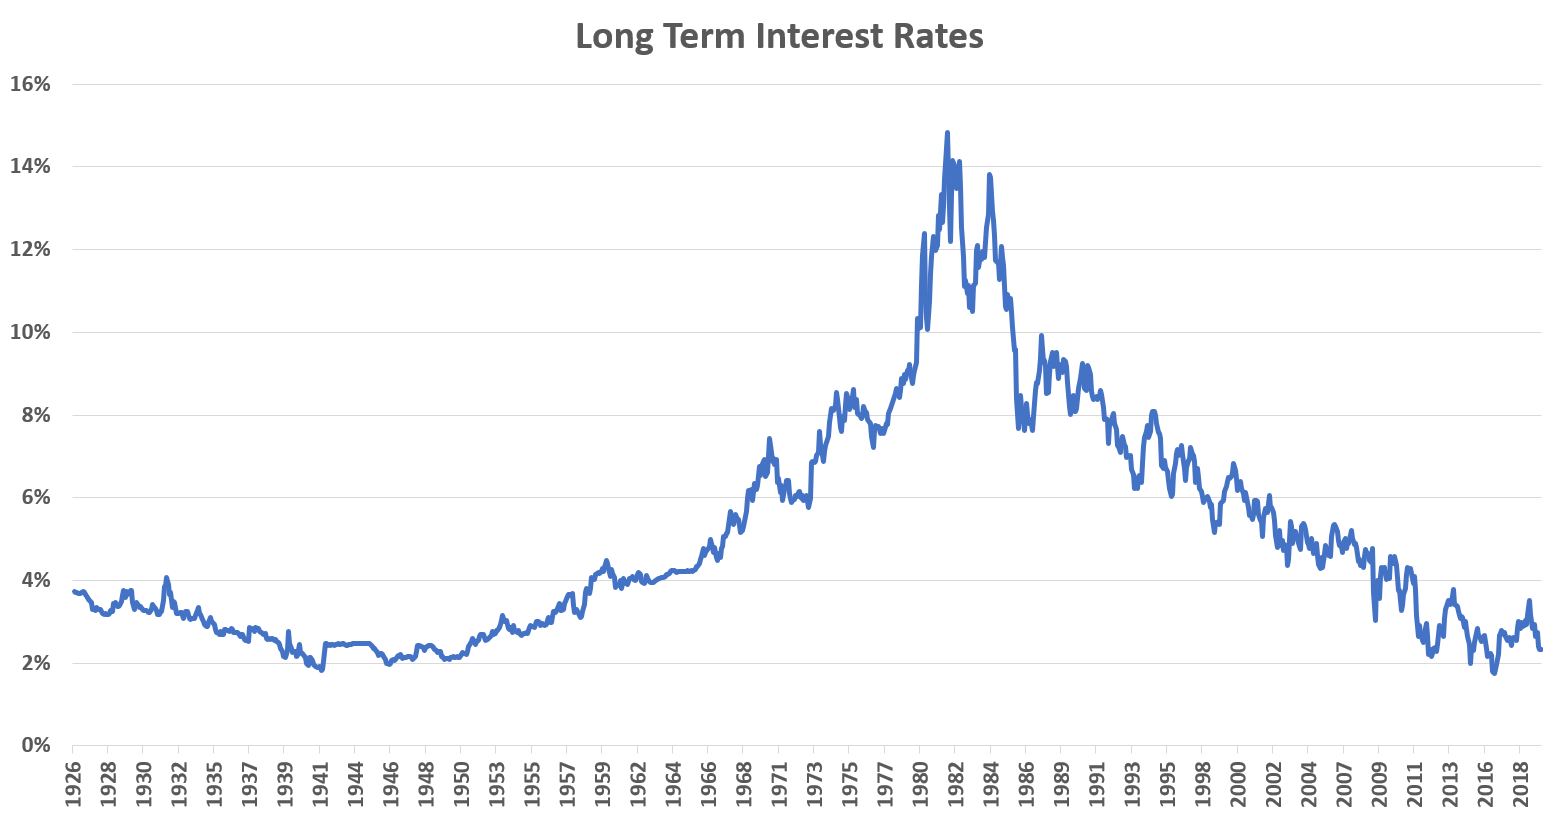
We could appropriately title this graph “the rise and fall of interest rates in America.” Much of the hand-wringing over low interest rates over the last several years comes from the fact that many Americans alive today are old enough to remember the much higher – even double-digit – interest rates that existed back in the 1970s and ’80s. Fewer people are still around who remember the much-lower rates that persisted throughout the first half of the 20th century – rates that were much more comparable to those we see today. From this longer historical perspective, it was the interest rates the baby boomers grew up with that were anomalously high, not the interest rates the millennials grew up with that are anomalously low.
Of course, inflation was much higher back then as well, and what we should really care about is the return an investment makes us after inflation. So to put rates over time on an even playing field we should look at real yields. Below I plot the real yield on the same index as above by subtracting the previous trailing twelve month rate of inflation. Now, this is a somewhat crude measure of real yields because interest rates fluctuate based on investors’ expectations of future inflation, so we should really subtract some market forecast of inflation, but we’ve only had observable market inflation forecasts since the inception of TIPS and the TIPS spread in 2003, so I’ll use this rearview-mirror adjustment through what follows.
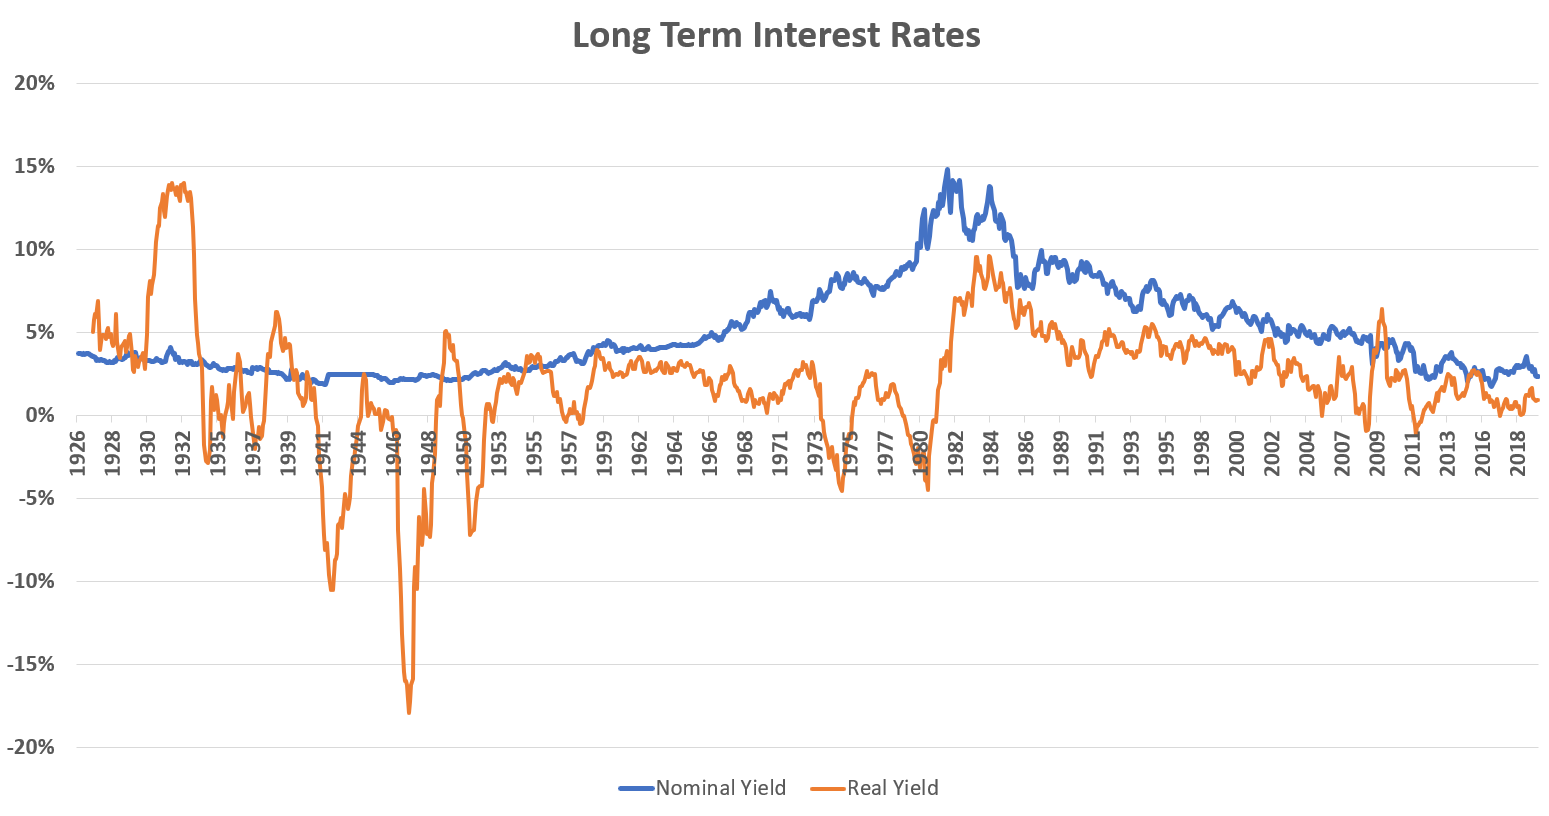 Real interest rates fluctuate quite a bit more and often fall below zero (meaning bonds earn less than inflation), especially during the early period when macroeconomic activity was much more volatile. In this light, interest rates today don’t seem so out of the ordinary at all. The average real yield over this near-century-long sample is 2.09%, and as of the end of July 2019 they’re at 0.94%, only a little bit lower, compared the normal range of fluctuation.
For most observers, this is where the analysis stops. But inflation isn’t the only thing that’s changed over time. So has the riskiness of long term government bonds. When you read about bond yields falling in the financial press you’ll often see talk of traders “fleeing risky assets” to the “safe haven” of treasuries. The perception is that government debt of the United States and other advanced countries offers protection against losses in stocks and other assets susceptible to macroeconomic shocks. But as much as this notion is taken for granted these days, it was not always quite the case.
In financial economics the most important measure of risk is beta. Beta is a somewhat technical concept that I won’t go into detail on here, but it’s basically a measure of how sensitive an asset is to the macro-economy. High positive betas mean an asset will do poorly during a recession. Negative betas mean it will do well. A beta close to zero means it won’t be affected one way or another. Beta is typically defined with respect to a broad stock index such as the S&P 500, which is supposed to proxy for macroeconomic conditions. So the broad stock market has a beta of 1 by definition, assets with betas higher than 1 (think stocks of IPOs) are riskier than stocks, less than 1 are less risky, and less than zero mean they make money when stocks lose money, a “safe haven.”
Below is the rolling three-year beta of our long term treasury bond index against the S&P 500.
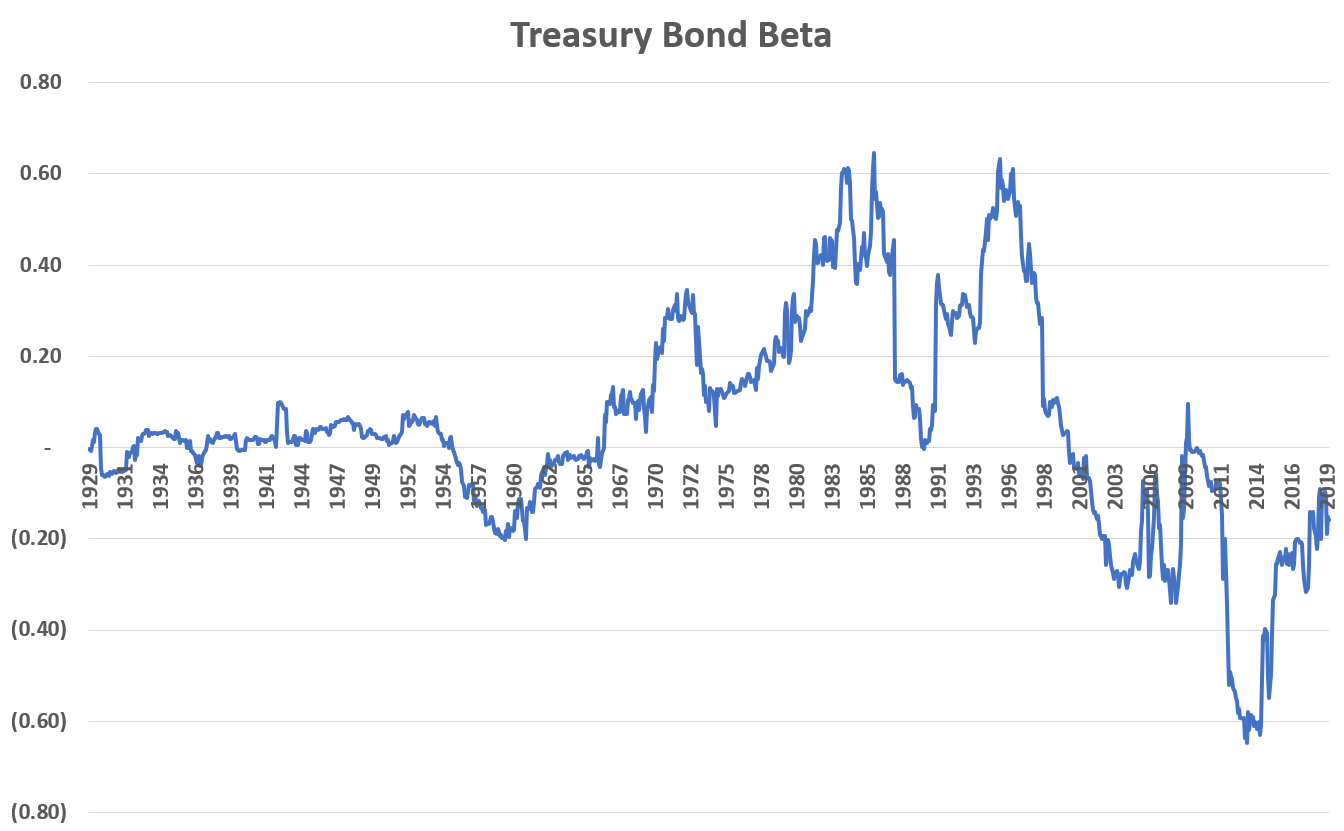
Treasury bonds have seemingly gone through three key phases over the last century. In the early period, they had a beta close to zero, approximating the common notion in finance of the “risk-free rate.” Bonds and stocks had nothing to do with each other, which basically meant that bonds had nothing to do with the rise and fall of the economy. Then, as inflation started to take off in the late ’60s, bonds started to act more like stocks as beta increased. In the ’70s, stocks and bonds suffered alike, and in the ’80s they both entered a bull market. Finally, since about the turn of the new millennium, the beta on bonds has been less than zero on average, effectively hedging the risk of stocks. Long term treasury bonds famously posted better-than-usual returns during both of the two crashes of the last twenty years: the dot-com bust and the financial crisis, cementing their safe-haven status.
So why do I bring up beta? Because according to financial theory beta is supposed to be the key determinant that sets expected returns on all assets. And while the real world is a bit messier than theory, if you look at the cross-section of long term returns across global assets, beta does indeed explain most of the variation, i.e. higher beta assets earn higher returns and lower beta assets earn lower returns. So now that treasury bonds have negative betas, we shouldn’t be surprised to see that they now have very low yields. In fact, since a negative-beta asset basically acts like insurance against losses, rational investors should even be willing to pay in order to own such assets. This is why I claimed that negative-yielding bonds were not at all mysterious back in 2016.
What’s more, we can use beta to determine what the yield on treasury bonds “should” be. In theory, an asset with a beta of one is as risky as the stock market and should therefore earn its return, while a zero-beta asset should earn the “risk-free rate” or the natural rate of interest, which in practice should be pretty close to the inflation rate. Using that, I calculate the “predicted yield” on the treasury bond as simply its trailing beta times the real expected return on the S&P 500, which I take to simply be the real earnings yield (I’ve written about this measure before here and here). I then subtract this predicted yield from the actual real yield at each point to get the “excess yield”, how much higher or lower the real yield is compared to what it should be given the risk.
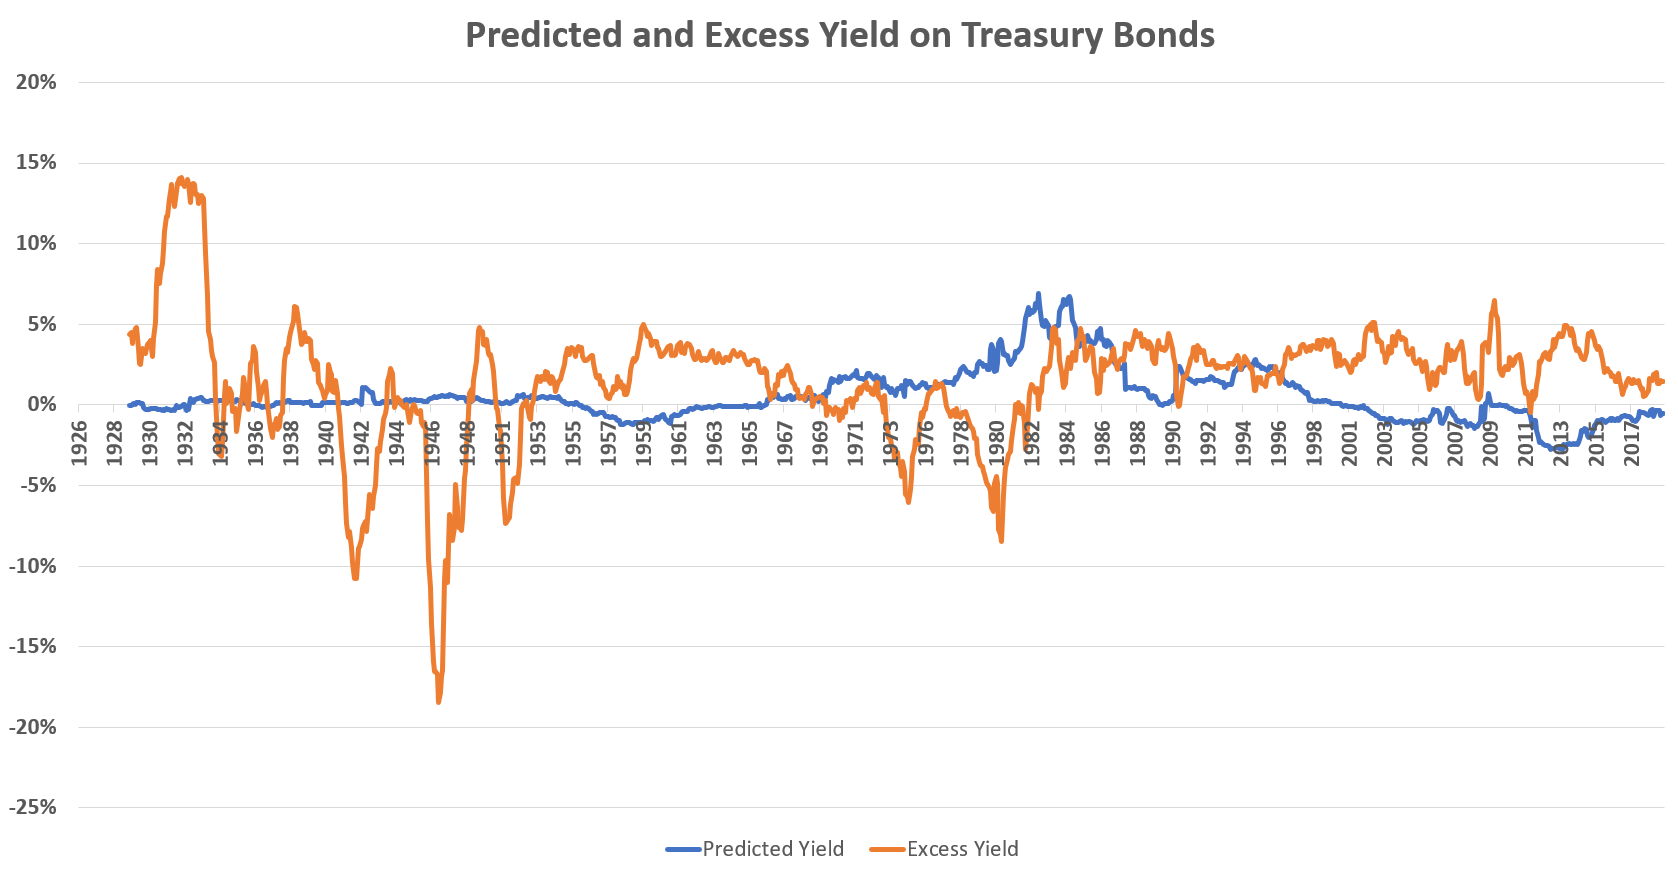
Since around the year 2000, the predicted or “fair value” real yield on treasury bonds has been negative, reflecting its utility as a tool for hedging risk. The latest predicted yield as of the end of July was -0.52%. With the actual real yield being positive 0.94%, this means the treasury bond has an “excess” yield of 1.46%. In other words, even at the record low yields we’re currently seeing, treasury bonds are trading below their fair value and are a good deal given their risk. Now, I’ll hasten to add that this is a fairly coarse-grained analysis and I’ve made a lot of simplifying assumptions that I’ve glossed over here for the sake of exposition, so you shouldn’t take these exact figures here very seriously. The point is that records though these latest yields may be, once we do a fair accounting for inflation and risk, they are really nothing out of the ordinary.
What is the Risk-Free Rate?
This may still feel a bit unsatisfactory, like I’ve pushed the question back one step. So why has the risk profile of treasury bonds changed so much over time? And anyway this whole analysis has been talking about long-term interest rates; short term rates, like cash in the bank, have been earning less than inflation for a while now, so what gives?
Back in my earlier post on the topic in 2016, I explained the changes in terms of the relative risks of inflation versus deflation. Inflation hurts bonds, but they are helped by deflation, while stocks are hurt by both (they prefer a Goldilocks middle). In ’60s, ’70s, and ’80s, when inflation risk ruled, bonds and stocks were similarly exposed and so were similarly behaved. In the financial crisis, we had a brief bout of deflation, which sent stocks and bonds in opposite directions. But aside from that, since the turn of the millennium we’ve basically returned to an era of low and stable inflation like we saw in the old days when we were on the gold standard. So why hasn’t the beta on bonds returned to the basically zero level that persisted back then? The answer, I believe, has to do with the key role the US dollar and financial system plays in today’s globalized economy.
Since antiquity, gold was the quintessential safe haven asset during hard economic times. Because the supply of gold generally only grows very slowly and predictably, its scarcity has acted as ballast against the expansion and contraction of credit that has been the hallmark of the business cycle since the late Renaissance. We wouldn’t quite say that gold had higher returns or rallied during recessions back then, because by the 19th century most every major country’s currency was defined in terms of gold, so that $20 was simply the definition of an ounce of gold in the US, for example. The problem was that in hard times these definitions had a tendency to break down. Your local community bank might refuse to redeem your paper money for gold, and the government central bank might refuse redeem its private bank reserves for gold. There was a hierarchy of money, and government issued legal tender was not at the top, which is plausibly why government bonds were never quite considered a safe haven. There was always the plausible risk that governments may fail to meet their obligations in terms of actual gold. Indeed, throughout the 20th century every single government eventually devalued and defaulted on its gold promises, including the United States, first to domestic parties in 1934, then to the rest of the world in 1971.
The end of the international gold standard in the 70s brought with it a decade of high inflation and macroeconomic turmoil around the world. But by the mid-80s the Federal Reserve and many other central banks of developed countries had tamed inflation by carefully controlling the growth of the money supply. Meanwhile, the world was becoming much more globalized and many undeveloped countries were beginning to take off economically – especially China. The US dollar had been the foundation of the international systems of payments since the end of World War II, but with gold de-throned, it was now quite literally where the buck stopped. The US dollar (and the currencies of other nations credibly committed to low inflation such as the Japanese Yen and the Swiss Franc) now sits at the top of the pyramid in the same way gold did in previous centuries, making it – and government bonds denominated in it – the preferred safe haven asset of the world. This has sort of odd consequences for those of us who use dollars on a daily basis that we don’t often consider. Nowadays in the US whenever there’s a recession and people are losing their jobs, real prices of goods and services mostly go down, because the dollar generally goes up with respect to other currencies. Compare this to when developing countries like Argentina or Turkey or Russia have financial panics: their currencies fall and prices soar, delivering the miserable double-whammy of inflation and recession at the same time. The last time this happened in the US was in the “stagflation” era of the ’70s before we had re-established monetary credibility.
Okay, what does all this have to do with bonds and betas and real yields? My claim is that the risks and therefore the yields on government bonds have changed over the years because the underlying nature of our money has changed. A century ago dollars were intermediate claims, IOUs for gold that were fairly but not perfectly secure… until they weren’t, in the mid-20th century when they became untethered and devalued, as susceptible to shocks as private credit and business equity, until the late 90s when they finally became firmly anchored to low and stable inflation expectations, and now the-thing-itself, the ultimate claim on economic resources above all others, like gold before it.
And this brings us to short term interest rates: the yield on cash and cash-like instruments. There’s a concept in finance, one that’s probably more central than gravity is to physics, this notion of the “risk-free rate.” It’s a phrase I’ve already used a couple times in this post, and like my colleagues and financial industry peers, I probably say it at least eight times in a normal business day without batting an eye. But it’s an idea that’s always bugged me a little bit in the back of my mind, because I kind of secretly think it’s sort of meaningless.
The “risk-free rate” is usually taken to mean the yield on treasury bills with one year or less to maturity. The idea being that over this short horizon you know exactly what your return will be, since it’s a government bond issued in its own currency, there’s virtually no chance of default, and even if interest rates change in the interim the maturity is so short that there won’t be any meaningful price fluctuation. You know exactly what you’re going to get, so it’s risk free. The problem, though, is that you don’t actually care about what number of dollars you have in your account in exactly one year, you care about being able to transmute those dollars into groceries and travel and entertainment and the other goods and services you buy, independent of the economic conditions that exist at that time. If you get your guaranteed 5% after one year but prices have unexpectedly gone up 10% that’s no good, if prices go up 10% at the same time as you lose your job that’s even worse.
We have a problem of relativity; the yardstick with which we want to measure our financial and economic activity is itself influenced by our financial and economic activity. In this sense money is to the financial industry like the proverbial water the fish swims in but is unaware of. And with that in mind I present the cumulative, total, after-inflation return of the US one-month treasury bill, the quintessentially “risk-free” asset, since 1970, the post-gold-standard era. This is comparable to what savers might earn on a money market fund or a competitive savings account.
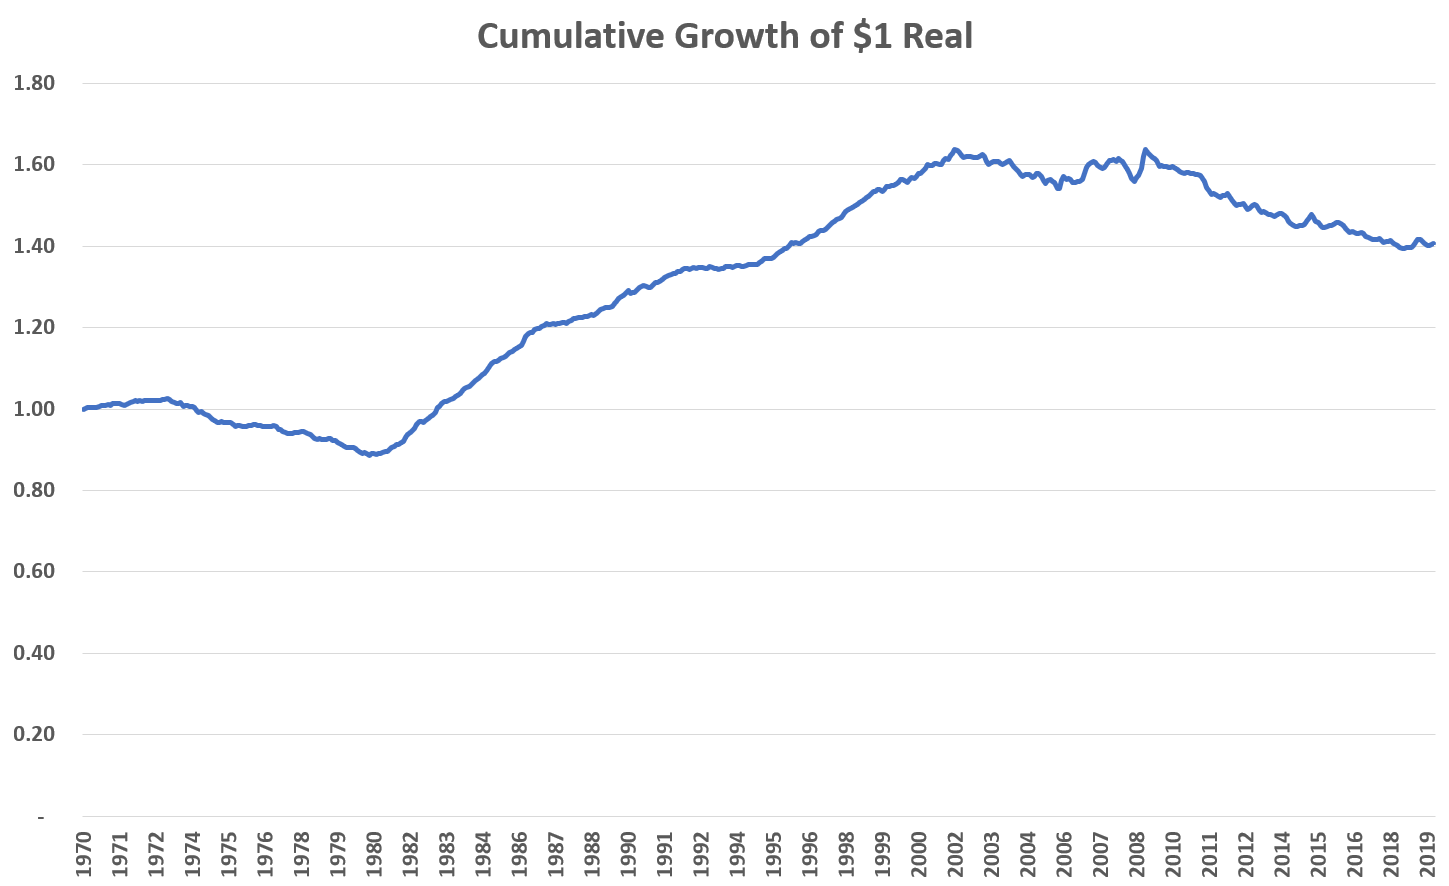
Investing in T-Bills lost 11% after inflation in the ’70s. It turned around and earned decent returns in the ’80s and ’90s. But since about 2002 it’s been losing money to inflation pretty consistently. The total annualized real return over this period was 0.69%, with a 1.20% standard deviation.
I don’t think losing money in three out of five decades is consistent with what most people think of when they hear “risk-free”. So what’s happening here? Here’s my story: in the ’70s the dollar itself was a positive beta asset, and its value fell alongside stocks as economic conditions deteriorated and inflation surged. In the ’80s and ’90s inflation expectations fell and the dollar rose against most other currencies, and thus dollar assets outpaced the rate of inflation. Since the new millennium the dollar, being the reserve currency of the world, has become a negative beta asset, which drives its equilibrium interest rate below its inflation rate, and so short-term deposits and debts denominated in dollars (and yen, and euros, and francs) such as treasury bills now lose money in real terms. Just as the cost of securing and insuring gold was just part of the overhead of running a bank back in the old days, so too is the depreciation associated with holding deposits in a reserve currency simply the cost of doing business today in a stable, prosperous, globalized economy.
US T-Bills are not the risk-free asset, they are the risk-reducing asset, and longer-term treasury bonds even more so. In my view, the “risk-free rate” ought to be more like a hypothetical zero-beta portfolio, where we both abstract away from the currency measurement problem by measuring returns using a basket of currencies or a basket of goods and services, and we measure beta not against the stock market but by a more general proxy of the economy including human capital, probably using dynamic stochastic general equilibrium models or something. But that sounds like a lot of work and not a lot of fun, so I’m going to do something quick and dirty to support my claim that interest rates are not actually very low right now.
So to construct a zero-beta portfolio I collect a handful of high-grade debt indexes including T-Bills, intermediate and long term treasury bonds, short and long term investment grade credit, international (developed market) sovereign bonds, and US dollar emerging market debt going back to 1970. I then solve a simple optimization problem each year where I allocate across these indexes to maximize the current yield while keeping the portfolio’s beta against the world stock market (MSCI World) as close to zero as possible. The goal here is to derive something that more closely matches our intuition of the “risk-free rate” as a return that steadily grows our purchasing power with minimal volatility or sensitivity to macroeconomic conditions. Here’s how that portfolio shifts over time.
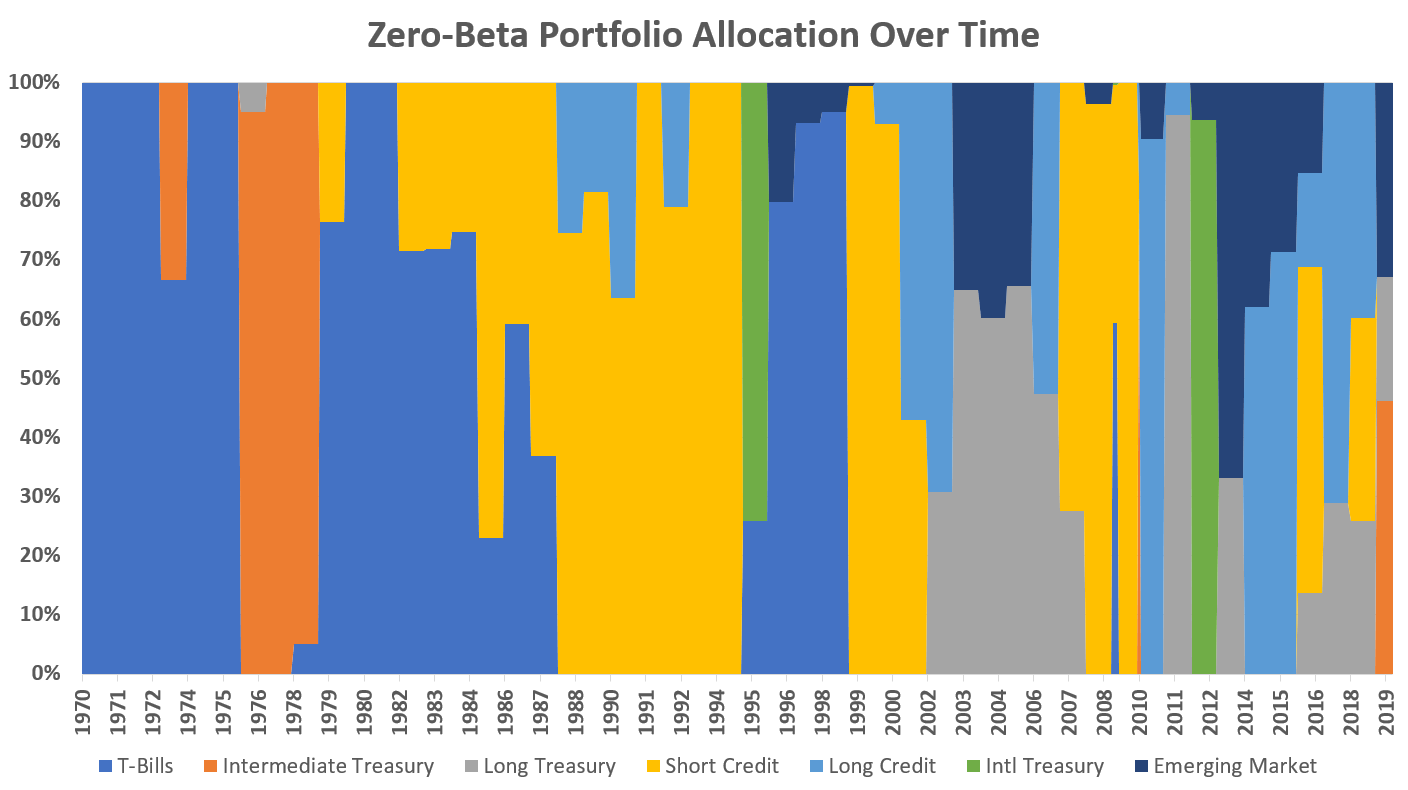
The portfolio spends most of the ’70s in T-Bills and intermediate treasuries, but by the ’80s it’s allocating most or all of the portfolio to credit-sensitive sectors. In recent years the portfolio puts a lot into longer-term private debt and the sovereign debt of emerging market countries, sectors that would have been much riskier in earlier periods but now are virtually unaffected by the ups and downs of the economy.
How does this portfolio perform compared to the more conventional definition of the risk-free rate? Here’s it’s cumulative, after-inflation performance in comparison to T-bills.
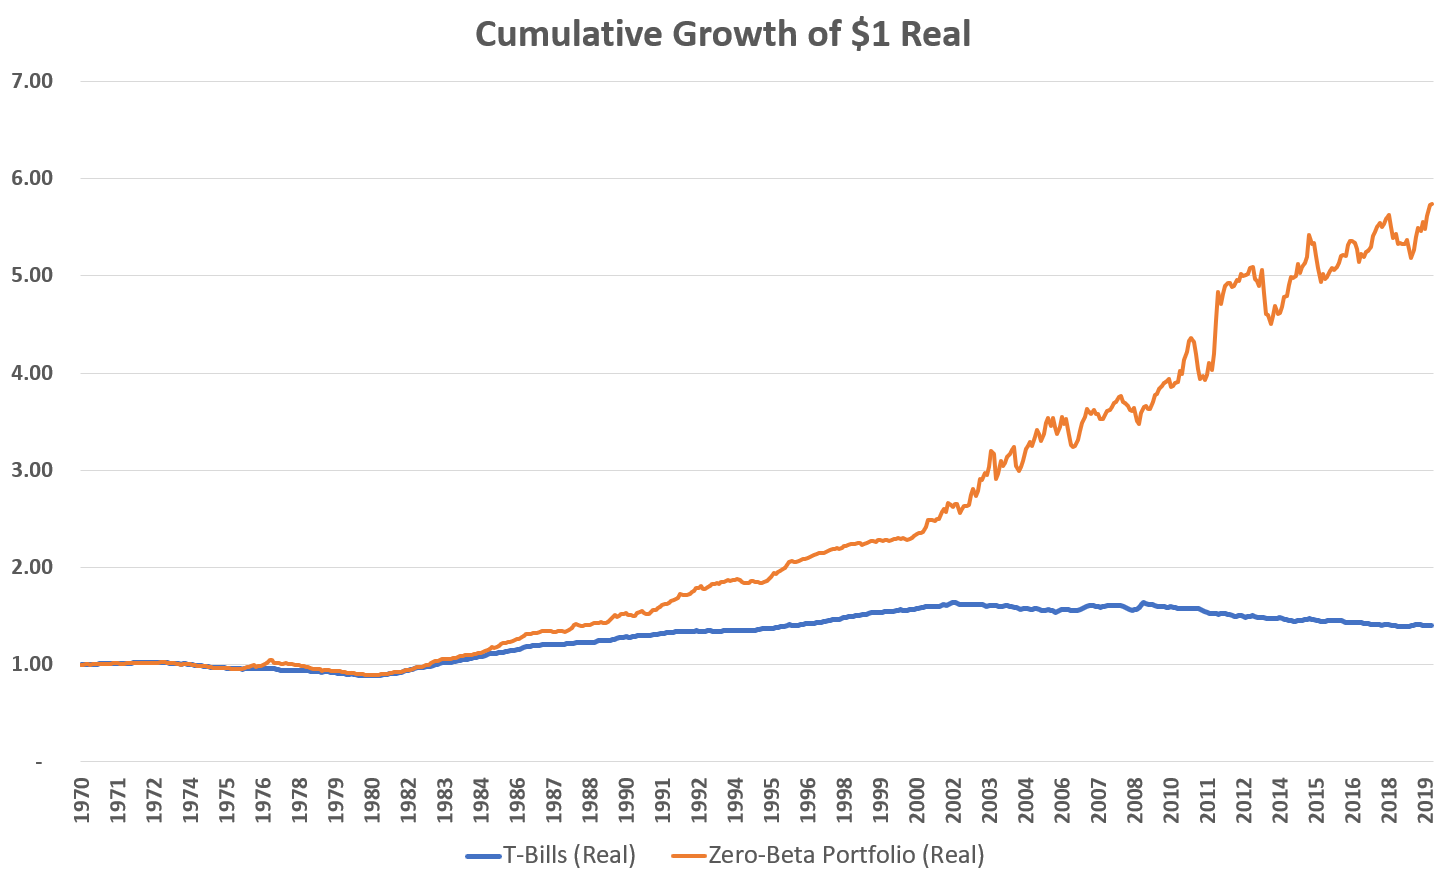
While the returns are a little more jagged in recent years than I would have liked (this could probably be improved with more careful optimization done at higher frequency), the zero-beta portfolio mostly accomplishes what we want it to and better accords with our intuitions about “risk-free” returns. Aside from the stagflationary ’70s, where it still holds up slightly better than T-bills (it bottoms out at 90 real cents versus 89 for T-bills), the zero-beta portfolio consistently increases in real value over time across a variety of market conditions, rarely losing ground for very long. The annualized total real return is 3.59% with a 4.69% standard deviation and, true to its name, its beta against the global stock market over this time is 0.02, statistically indistinguishable from zero. The portfolio moves almost completely independent of the expansions and recessions of the economy, and so is essentially risk-free from a financial perspective.
And now for the money-shot. How has the interest rate on this different kind of risk-free rate evolved over time? Below I plot the real yield on the zero-beta portfolio.
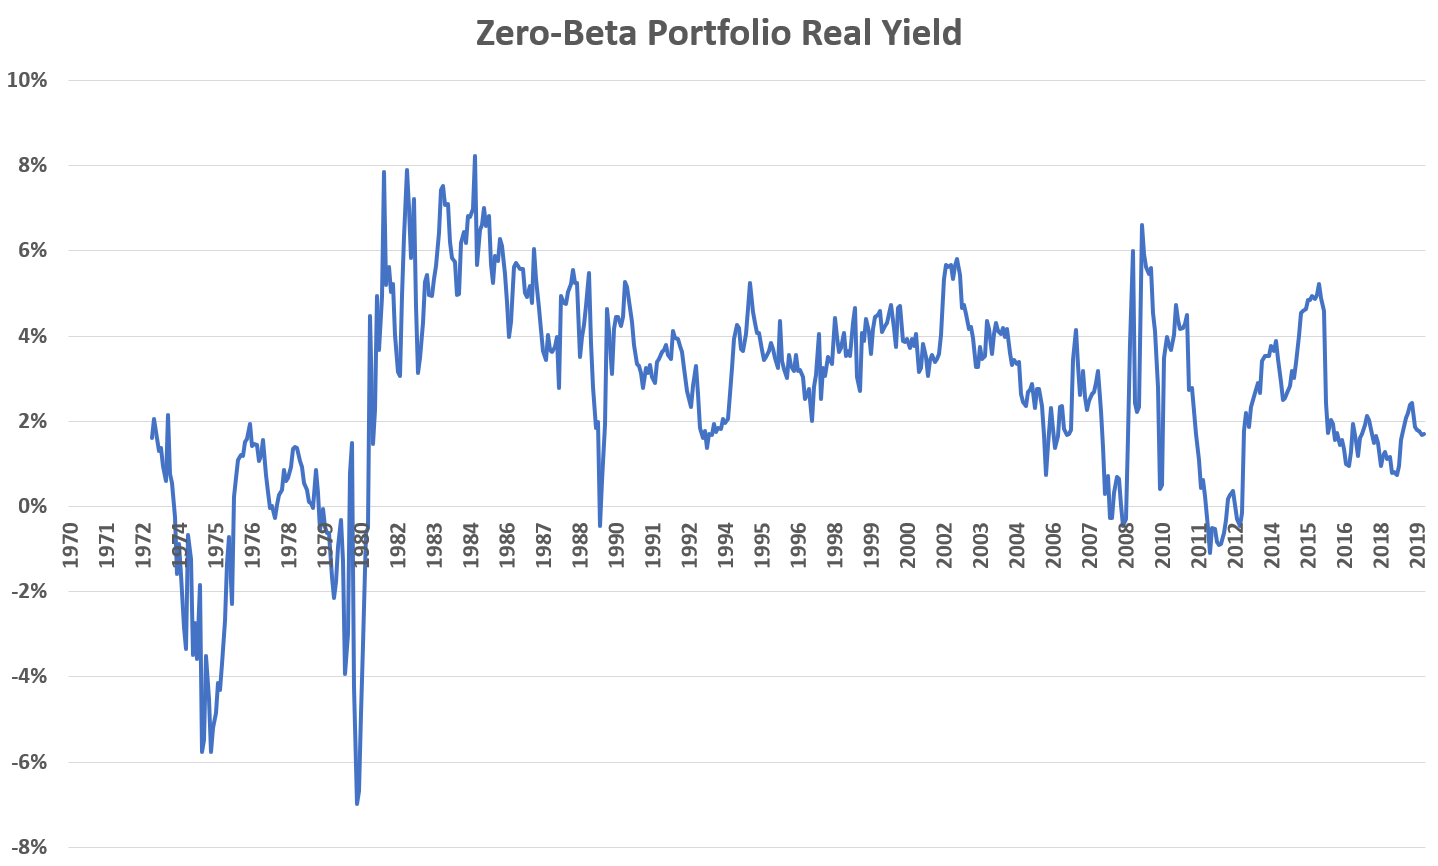
The real yield has bounced around a lot, from as low as -7% to as high as 8%. It’s average over this half-century period was 2.70%. Right now it’s 1.69%; definitely below average, but not by a whole lot, in fact it’s only in the 29% percentile. Again, with more careful construction I suspect this series would be less volatile and the most recent value perhaps even a bit higher. This is a fairly seat-of-the-pants analysis and shouldn’t be taken as definitive of anything. But it does suggest that the persistently low interest rates we’ve been seeing on the government debt of the United States and other advanced nations is not necessarily a sign that something is deeply wrong with the global economy. On the contrary, I take it to mean that the global economic system has become extremely robust. As I’ve written before, the world keeps becoming less risky while economic growth keeps speeding up. (I should note that I’m talking about long run trends here and in the short run we still face recession risks. Given that we’ve been in an economic expansion in the US for over ten years now, it shouldn’t be too surprising if we enter a recession in the relatively near future.) And if you’re complaining that you can’t earn a decent interest rate on your money anymore like you could a generation ago, it’s because your money is a lot less risky than it was a generation ago. If you want an attractive yield go put your money where it’s most useful and invest in emerging markets. (I’ve written about that too!)


