
A couple months ago, I wrote about the dangers of levered ETFs, showing how these products designed to juice investor’s returns end up eroding capital due to the subtle mathematical logic of compounding. In my last post, I followed up on the topic by describing the Kelly Criterion, a mathematical framework that can tell investors what the maximum amount of risk or leverage is they can take in order to increase returns. We found that beyond a certain point, increasing the risk or taking on more leverage on an investment portfolio inevitably reduces the (geometric) return the investor receives, and that most levered ETFs probably exceed this optimal point. Today, I’m going to tie up this thread by describing an investment strategy we have been experimenting with that seeks to exploit these phenomena I have been writing about. How can we profit by betting against those who bet too much?
Note: this post will A) be rather technical; and B) describe a highly exotic, complicated, and potentially very risky trading strategy. The following is provided for informational purposes only and is definitely not a recommendation as an investment strategy. Don’t try this at home, as they say.
As a refresher, in the last couple posts I showed how levered ETFs have generally failed to deliver the long run returns one might intuitively expect given their leverage ratios. The first levered ETF, SSO, for example, which applies 2x leverage to the S&P 500, has only slightly outperformed its unlevered counterpart SPY.

As one might expect, SSO has experienced twice the volatility as the S&P 500, but its annualized return since inception through June 2017 has only been 1.23 times greater. The more volatile the underlying investment, and the more leverage being used, the greater this disparity will be, to the point where in some cases a levered ETF will even substantially underperform its unlevered counterpart in an up market. Witness EDC, a 3x levered emerging markets ETF, compared against a plain vanilla Vanguard emerging markets ETF:

Three times the risk, less than a quarter of the long-term returns. In the language of financial statistics, we would say that these securities have a beta – exposure to the risk of the market – exactly as expected; thus SSO has a beta of 2 against the S&P 500 and EDC has a beta of 3 against the emerging markets index. But their alpha – the return that is not explained by their beta – is significantly negative. Typically in finance we use alpha to asses the “skill” of an investment manager. Positive alpha indicates a manager or strategy that is adding excess returns above what would be expected by the risk being taken. Negative alpha indicates the strategy is underperforming. But the negative alpha of these levered ETFs is not the result of any lack of skill on the part of the managers (who are after all, simply following a mechanical trading formula), nor is it the result of any inefficiency in the market as such, but rather it is the inevitable result of the volatility drag these instruments suffer as the random noisiness of price movements grinds away at their capital.
The structurally negative alpha of these securities makes them terrible long term investments. But if they’re terrible longs, how do they work as shorts? The predictable and stable betas and reliably negative alphas of levered ETFs makes them potentially extremely powerful sources of market neutral excess returns.
Let’s start with a simple example using SPY and SSO. Suppose an investor is invested 100% in SPY, an S&P 500 ETF. For every dollar invested in SPY, she then sells short 50 cents of SSO, a 2x levered S&P 500 ETF. Because she is long $1 of an asset with a beta of 1 and short 50 cents of an asset with a beta of 2, her overall beta is zero, i.e. she is market-neutral, and the returns on her portfolio should exhibit very low volatility. Now, over time the values of the two securities will change relative to each other, so she will have to periodically rebalance back to her initial allocation in order to maintain her market neutrality. But if a market-neutral position can be maintained, then it doesn’t matter whether the market goes up or down, her returns will only be the result of the amount of volatility drag that SSO experiences. If the negative alpha the investor harvests from SSO is greater than the cost of borrowing the shares, then our investor earns “risk-free” returns.
Below, I plot the returns to such a strategy from August 2006 to June 2017, using monthly rebalancing and assuming a borrowing rate equal to the federal funds rate. I also include the growth of holding cash at the federal funds rate for comparison.
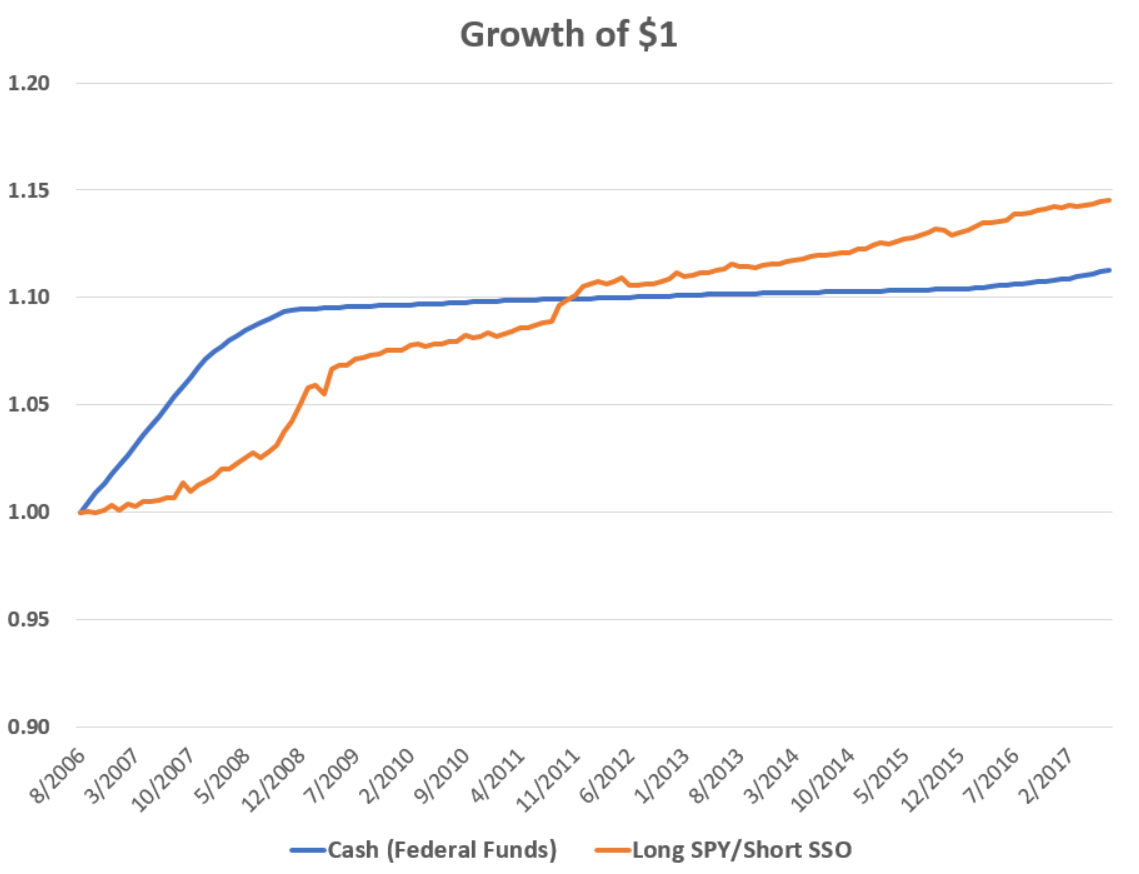
Success! The market-neutral strategy delivers steady, positive returns in excess of cash over the period. Though cash outperforms in the early part of the sample back when savers could earn north of 5% on their cash, the strategy begins handily outperforming following the financial crisis when short term interest rates fall close to zero. The annualized return over the entire period is 1.24% for the strategy, versus 0.98% for cash, and statistical tests confirm the difference is significant. The strategy also has no statistically significant correlation with the S&P 500, and the volatility of returns is very low indeed at an annualized standard deviation of 0.69% (by comparison, the figure for the S&P 500 over the same period was 15.8%).
Now, in this example we used an unlevered ETF for our “long” and a levered ETF for our “short.” What if we short levered ETFs for both legs of our exposure? By shorting an inverse ETF we can achieve the same beta exposure for the long end of our trade while seeking to harvest the volatility drag for that instrument as well. SDS, the ProShares UltraShort S&P 500 ETF is the mirror image of SSO, launched on the same day back in 2006. It delivers negative 2x exposure to the S&P 500, thus short selling a dollar of SDS is equivalent to being long $2 of the S&P 500. Inverse ETFs suffer volatility drag for the same reasons as levered ones do, the results of which can lead to surprising cases where sometimes an inverse ETF will be down even over a period where the underlying investment it was shorting was also down!
Below I add a new strategy in which our investor shorts 50 cents of SDS, and 50 cents of SSO for every dollar of capital he has, again with monthly rebalancing. The result once again is offsetting betas and a market-neutral portfolio. Because twice as much capital is devoted to short-selling now the borrowing costs are also twice as high.
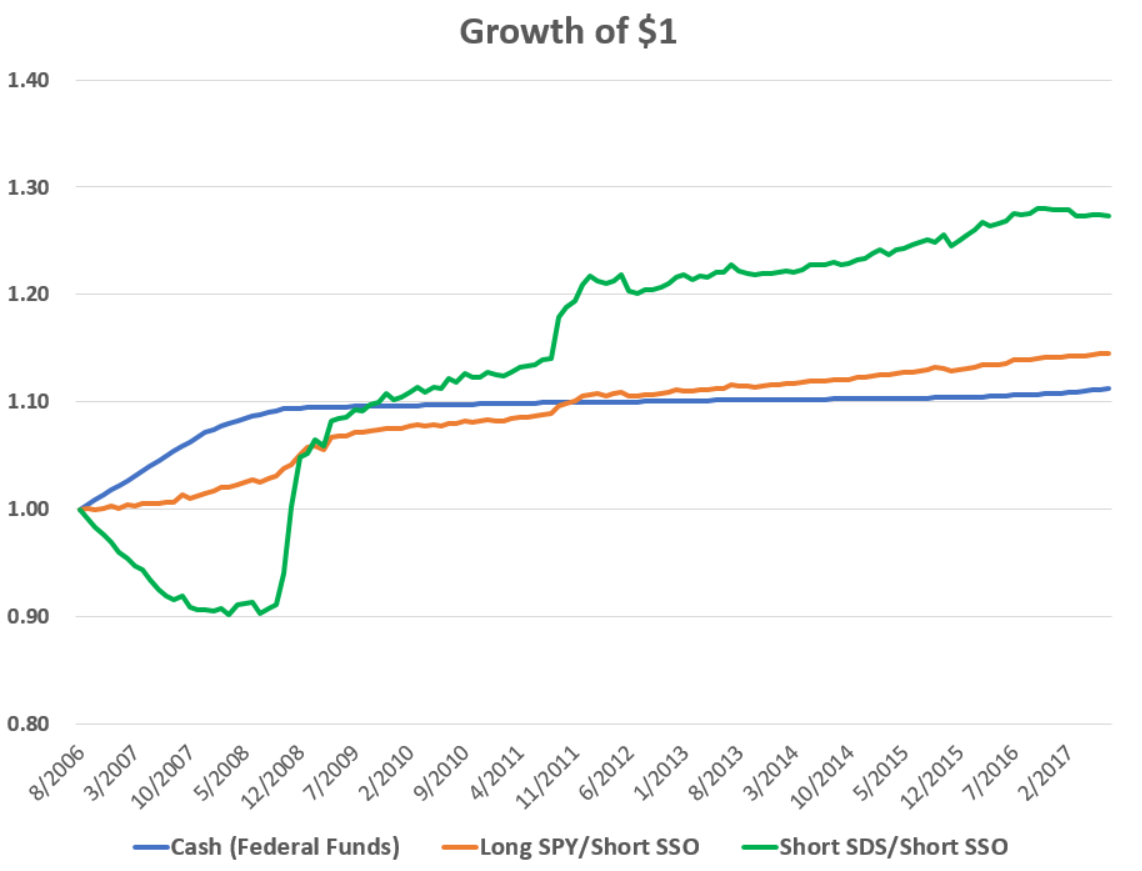
The strategy initially suffers as it cannot overcome the high borrowing costs associated with the early part of the period. But it quickly recovers ground as interest rates begin falling in 2008. The final annualized return to the strategy is 2.22%. Now, because the volatility drag is accruing to both legs of our trade this time there is greater chance for the relative sizes of our positions to fluctuate between monthly resets. This results in a slight erosion of the portfolio’s neutrality and a significant increase (though still small) of the volatility to 3.26%. Interestingly enough, however, this volatility moves in the opposite direction as the stock market; that is, the portfolio now has a small but significantly negative correlation with the S&P 500. Indeed, just eyeballing the graph you can see that the strategy’s greatest returns were earned during the 2008-2009 financial crisis and the 2011 eurozone crisis. Because our source of alpha here is the volatility drag of the levered ETFs, a short-levered ETF portfolio is essentially a strategy that “eats” volatility, and so tends to thrive in periods of market distress. This makes it highly desirable as a complement to portfolios with conventional risk exposures, as we will see shortly.
Let’s go nuts. We need not limit ourselves to market-neutral positions in the S&P 500. There are numerous levered/inverse ETF pairs with offsetting exposures in the market with which we can conduct similar trades. In the following test, I short a diversified portfolio of 10 popular levered/inverse ETF pairs across various equity, fixed income, and commodity asset classes. The securities have inception dates ranging from 2006 to 2012, so each month I allocate 1/n of the portfolio’s capital to each of the short positions, where n is the number of securities available that month. Thus, in the beginning I allocate 50% each to shorting SSO and SDS, when the second pair (UWM and TWM) becomes available I allocate 25% to each, and by the time the final pair (UGAZ and DGAZ) is available each security has a 5% allocation. I provide details on the securities in this footnote.[note]The long short pairs are as follows:
- SSO and SDS (2x S&P 500) in August 2006
- UWM and TWM (2x Small Cap) in February 2007
- UCO and SCO (2x Oil) in December 2008
- EDC and EDZ (3x Emerging Markets) in January 2009
- UPRO and SPXU (3x S&P 500) in July 2009
- UBT and TBT (2x 20+ Year Treasury) in February 2010
- UST and PST (2x 7-10 Year Treasury) in February 2010
- TQQQ and SQQQ (3x Nasdaq) in March 2010
- NUGT and DUST (3x Gold Miners) in January 2011
- UGAZ and DGAZ (3x Natural Gas) in March 2012
[/note]
The resulting portfolio looks like this:
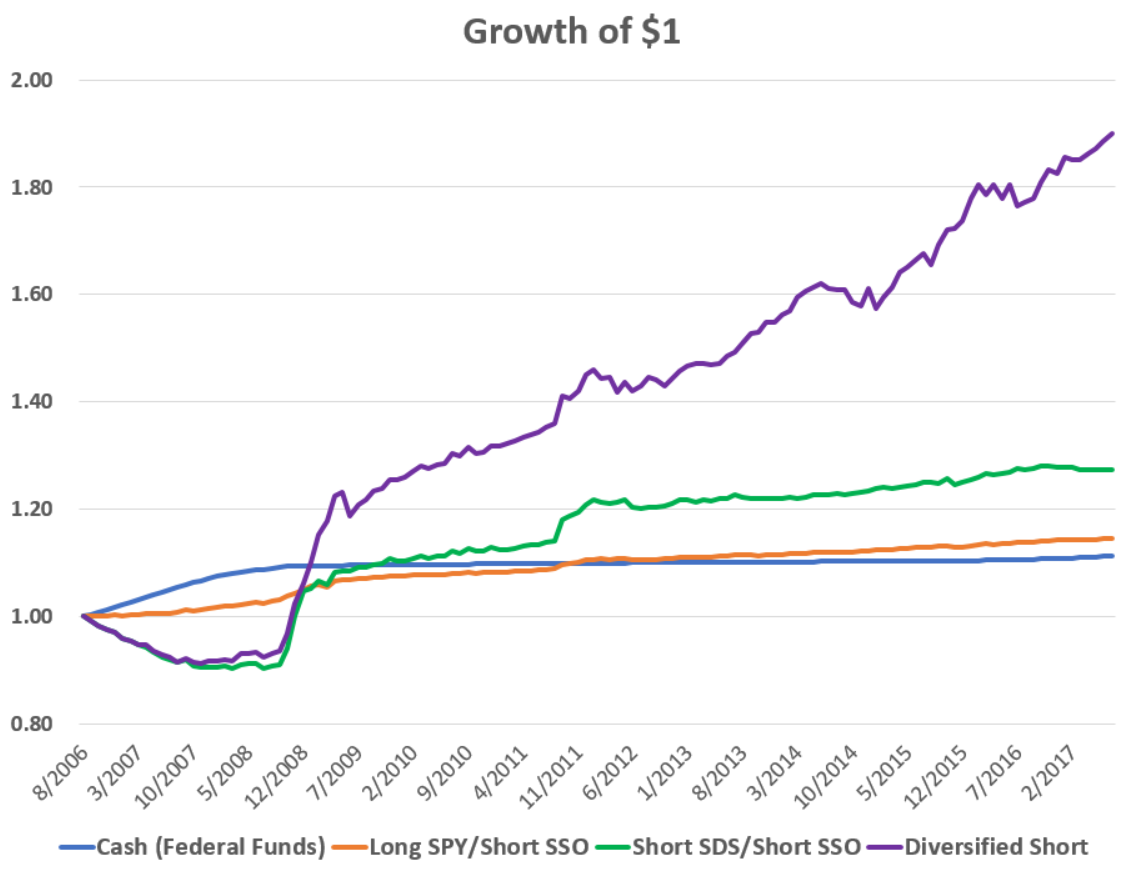 The annualized return to the diversified short levered/inverse ETF portfolio is 6.01% with a 4.56% standard deviation: nearly stock market-like returns with about a quarter of the volatility. Once again, the strategy has small but significantly negative exposure to stock market risk, and has zero to negative exposure to other conventional risk factors as well, such as interest rates and oil prices. So shorting levered/inverse ETF pairs, especially in a diversified manner, has several highly desirable characteristics, including:
- High return to risk ratio (Sharpe ratio): The Sharpe ratio for the Diversified Short portfolio is 1.11 over this period vs. 0.46 on the S&P 500.
- Works better when volatility (especially in the equity market) is high and thus when stocks are likely to be down.
- Works better when interest rates are low and thus when bonds are likely to deliver meager returns.
- Positively skewed: while the strategy occasionally earns large monthly gains its monthly losses tend to be small. This is the opposite of what we see in the stock market (and with most other financial assets).
This is all fine and dandy, but how realistic is this strategy? Unfortunately, it is not terribly so, at least in this form. Thus far I have been assuming these securities can be borrowed at the federal funds rate. In reality, the number of shares of these securities available for shorting is generally in short supply (ha) and they always lend at spreads well above fed funds. While for some of the larger and more liquid ETFs these spreads are only one or two percent, for others they can be as high as 10% or more, making them prohibitively expensive for market-neutral trades. What’s more, levered/inverse pairs are often “lopsided” in this regard, with one being relatively cheap to borrow but the other being extremely dear. As one particularly extreme example, UCO, a 2x levered crude oil futures ETF, can be borrowed for 1.81% as of the time of this writing, a mere 0.65% spread over fed funds. Its inverse twin sister SCO, however, is currently going for an outrageous 13.81%, making the prospect of pairs trading on them highly unlikely to be profitable.
So can this strategy be saved? I think so. There are still several levered and inverse ETFs that are relatively inexpensive to borrow, and even if we can’t get them together as pairs, we can still profit if we’re willing to do either of the following:
- Hedge with unlevered counterparts: this is what we did in the first case with SPY and SSO. As long as we can short the levered ETF inexpensively, we don’t need to short the inverse twin if we can simply hold a long position in a plain unlevered version. With the example above with UCO, for example, we can simply hedge our short exposure by going long a standard long oil futures ETF such as USO.
- Depart from market neutrality and expose ourselves to market risk: market neutral portfolios are interesting from a theoretical perspective because they allow us to mathematically isolate our alpha, and they may be desirable to niche hedge funds trying to distinguish their risk profile, but for the vast majority of investors we want to have strategic, long-term exposure to traditional risky assets such as stocks and bonds, because bearing these risks has paid off in the past and is likely to continue to do so in the future. So, if we can short an inverse ETF on traditional equity or fixed income asset classes at low cost it may still be desirable to do so as an alternative to using conventional long-only methods. Fortunately, many of the inverse US stock and treasury bond ETFs can be borrowed at relatively low rates.
Let’s start with another relatively simple case. This time, instead of trying to achieve market-neutral “risk-free” returns we will consider an investor who is invested in or comparing himself to the S&P 500, a much more typical scenario. He could just simply invest his entire portfolio in SPY, or he could achieve the same exposure and try to earn extra returns harvesting volatility drag by allocating 50% of his capital to a short position in SDS, a -2x inverse S&P 500 ETF, and holding the rest of his portfolio in cash. Below I plot the returns to doing so, assuming a borrow rate of federal funds plus 1% (this is a conservatively high estimate based on recently quoted rates):
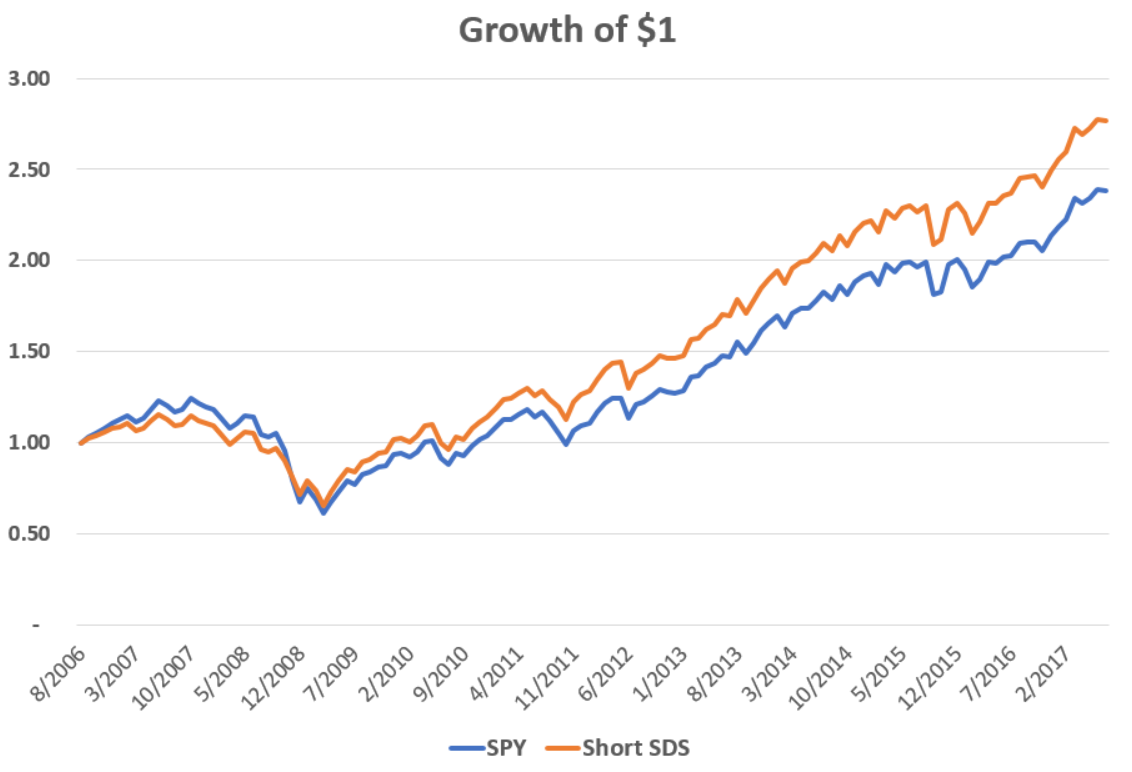 Even under conservative borrowing cost estimates, the Short SDS strategy outpaces SPY 9.70% vs. 8.23% annually with lower risk, as measured both by standard deviation (14.63% vs. 15.82%) and skewness (-0.67 vs. -0.99). There is yet an additional benefit to the strategy I haven’t discussed so far: taxes. Though buy-and-hold investing on equity ETF like SPY is just about the most tax efficient way you can possibly invest normally, an investor in SPY or any other broad equity market ETF will regularly receive dividends on her portfolio, which she will have to pay taxes on every year. When you sell an asset short, however, you don’t receive any taxable investment income associated with the position. Now, on the other hand, when you buy-to-cover and realize a gain on a short sale it is always realized as a short term capital gain, taxed at a higher rate than the long-term rates buy-and-hold investors typically enjoy, and rebalancing back to par every month like I have been in these backtests would result in lots of capital gains indeed. But if an investor is careful about managing turnover, and practices tax-loss harvesting and other tax-minimization techniques, then shorting levered/inverse ETFs has the potential to be a very tax-efficient strategy.
Finally, let’s consider a more diversified case of an investor comparing herself to a typical 60/40 stock/bond allocation. In this test, I will use four levered/inverse ETFs with relatively high liquidity and low borrowing costs, making the strategy more realistically implementable. Two of the ETFs are for market-neutral “arbitrage” trades, and the other two are for “directional” market exposure:
- SDS: a -2x inverse S&P 500 ETF, as above. A 30% short position achieves our strategic long exposure of 60% to the stock market.
- TBT: a -2x inverse Long Term Treasury Bond ETF. A 20% short position achieves our strategic long exposure of 40% to the bond market.
- UCO: a 2x levered Crude Oil Futures ETF. A 5% short position is combined with a 10% long position in an unlevered oil ETF (USO) for a market neutral trade.
- NUGT: a 3x levered Gold Mining Stocks ETF. a 5% short position is combined with a 15% long position in unlevered gold miners (GDX) for a market neutral trade.
All of these ETFs have $1 billion or more in assets under management besides UCO with ~$800 million, and can currently be borrowed for modest spreads over the federal funds rate. For the test I assume a rate of federal funds plus 1%, expect for NUGT at fed funds plus 3%. I compare this “enhanced 60/40” portfolio to a conventional long-only portfolio that is 60% invested in SPY and 40% in TLT, a long-term treasury bond ETF.

Once again adding diversification to the short levered ETF strategy pays off. The Enhanced 60/40 portfolio does substantially better than it’s long-only benchmark, indeed it’s total annualized return of 10.08% is better than an investment in SPY itself or the short-SDS strategy as above. Meanwhile risk measures of volatility, drawdown, and skewness are all also improved, all while incurring near-zero taxable investment income. Below are summary statistics for the above-tested strategies:

Assuming they can be borrowed at reasonable rates, shorting levered ETFs appears to be a robust way of improving portfolio risk-adjusted returns, so long as one can carefully manage their risk exposures. Is there any catch? The greatest risk seems to the risk of being pushed out of one’s position, which unfortunately is a very difficult risk to quantify. When you short sell any asset, you have to first borrow it from somebody willing to lend it to you, and that person can ask for it back at any time. Because levered ETFs are typically only held by investors for very short periods of time, the number of shortable shares can fluctuate quite a lot over time; if it falls too low, a short-seller can be forced out of their position. What’s more, this is probably more likely to happen during periods of heightened volatility, exactly when this strategy is most likely to pay off.
This is a strategy we have been monitoring for some time and are currently quite optimistic about. It is definitely unconventional and not something for investors to take lightly. In my next post I will come back to earth and consider some strategies that ordinary investors may want to consider given the currently elevated market we are in. Again, this is not a recommendation or a solicitation of the afore mentioned strategy.
Disclosures: This post is solely for informational purposes. Past performance is no guarantee of future returns. Investing involves risk and possible loss of principal capital. No advice may be rendered by RHS Financial, LLC unless a client service agreement is in place. Please contact us at your earliest convenience with any questions regarding the content of this post. For actual results that are compared to an index, all material facts relevant to the comparison are disclosed herein and reflect the deduction of advisory fees, brokerage and other commissions and any other expenses paid by RHS Financial, LLC’s clients. An index is a hypothetical portfolio of securities representing a particular market or a segment of it used as indicator of the change in the securities market. Indexes are unmanaged, do not incur fees and expenses and cannot be invested in directly.


